
The US Dollar Index saw a sharp sell off yesterday on the FOMC’s event, losing over -0.82% for the day. On the weekly charts, a bearish close today could signal a move to the downside and would set the US Dollar index for a two straight weeks of declines. The Federal Reserve, in its monetary policy meeting yesterday decided to leave the Fed funds rate unchanged at 0.25%. However, the Fed, in its rate projections still believes in a rate hike by the end of 2015. In effect although yesterday’s Fed event might have seen bearish, the fact still remains that the US is on path for a rate hike which could be decided as early as October or December of this year.
US Dollar – Technical Analysis
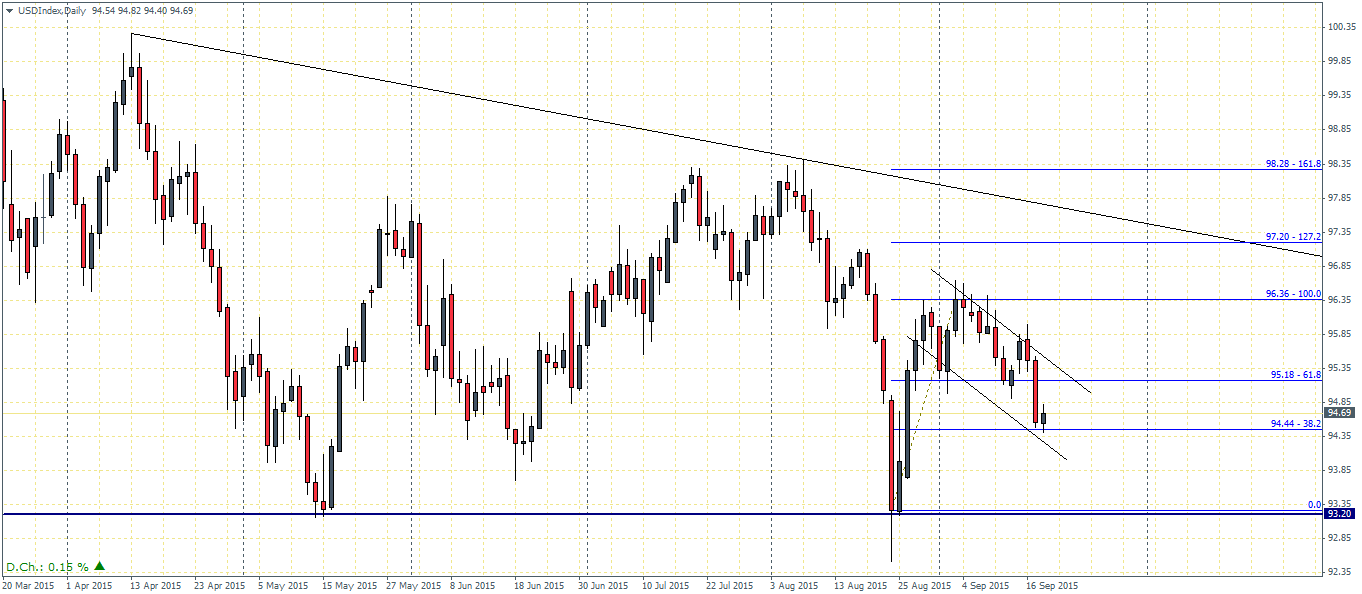
For the short term the US Dollar Index has posted some conflicting signals on the chart. Firstly, on the daily charts, we notice that within the largest descending triangle pattern, prices briefly tested the main support at 93.20 on 24th August and bounced off strongly towards 93.36 level of resistance. In the ensuing decline off the 93.36 level of resistance, the daily charts show a possible bull flag pattern that is taking shape currently. Of course, a close below 94.44 could potentially invalidate this pattern and could see the US Dollar decline back to the lower support of 93.20.

Looking to the 4-hour chart time frame, price action is currently trading near the previous known support/resistance of 94.56. The decline to this level could be seen as price attempting to establish support which if successful, could see the US Dollar rally back to the 95.52 – 95.2 level of support/resistance. A close above this level could potentially see the bull flag pattern on the daily charts being validated which will pave the way for a test to 96.6.
Another interesting factor to watch for is the formation of a potential inverse head and shoulders pattern. This reversal pattern is currently seeing the right shoulder being formed, which in all possibility would be validated only on a close above the 95.5 level. In the event that the inverse head and shoulders pattern is validated, it would be very bullish for the US Dollar Index as the minimum projected move to the upside comes in at 99.5, right near the previous highs.
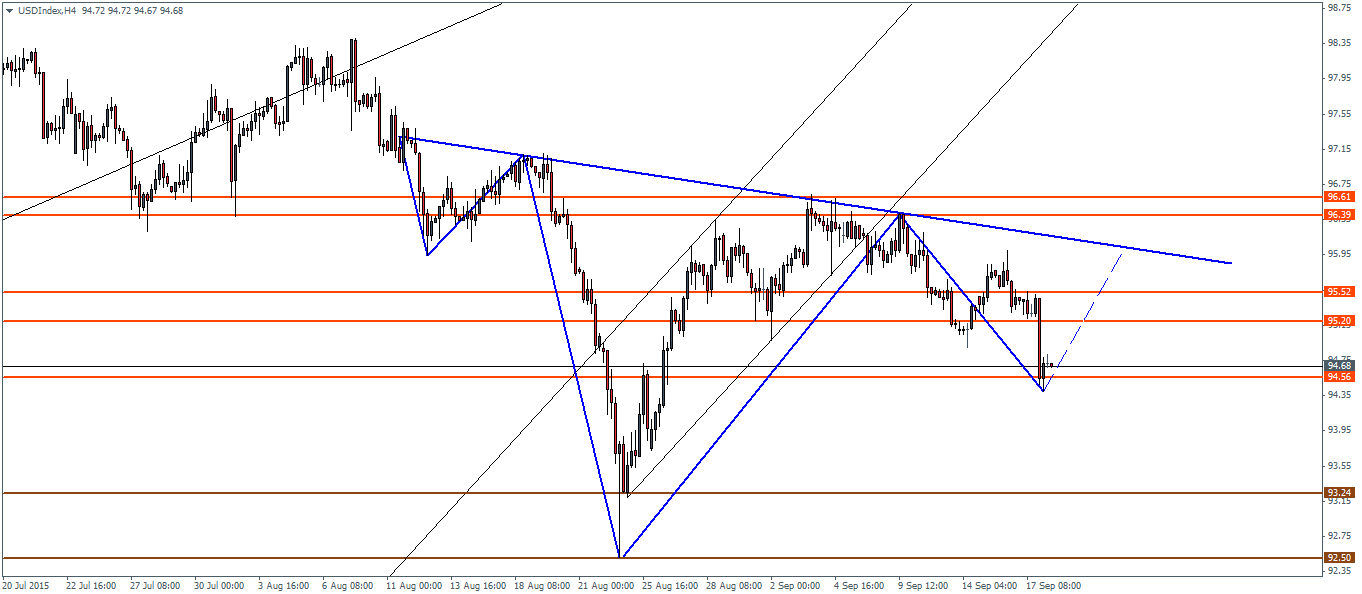
In terms of looking ahead to any data releases, the only major market shaping event is scheduled on September 24th when the monthly core durable goods orders are released followed by Janet Yellen’s speech a day later which will also see the US final GDP for Q2 being released. In the time being, we can expect the US Dollar index to gradually drift between the H4 support/resistance levels noted ahead of these events.

