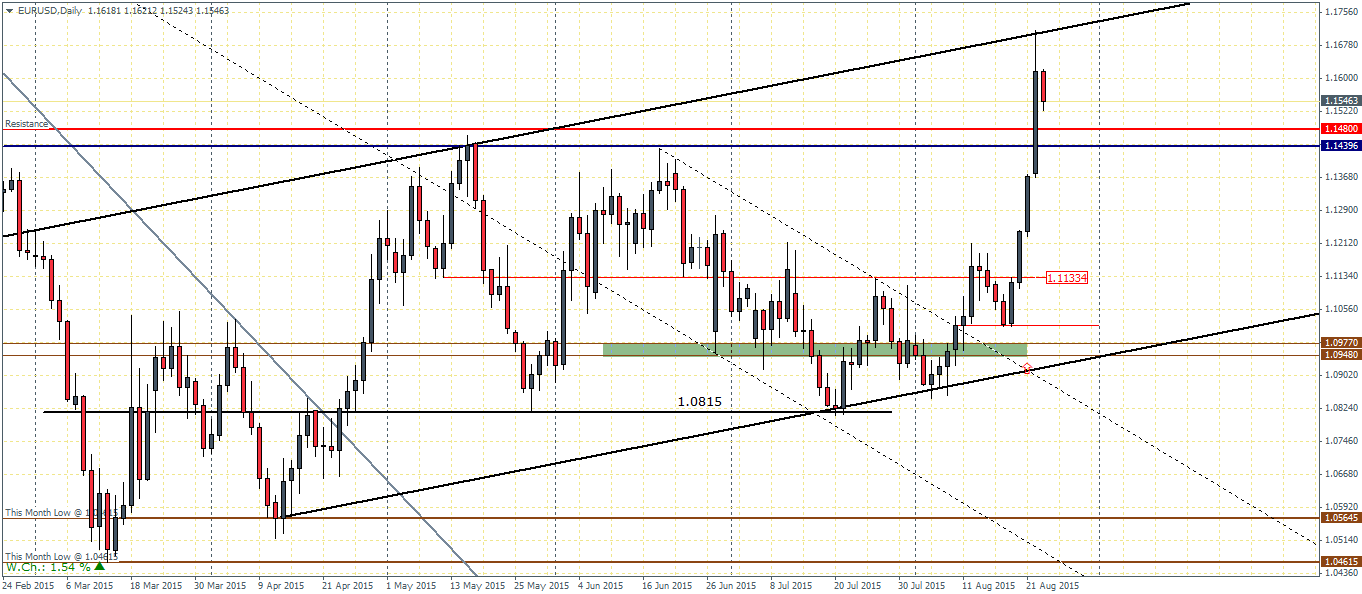
EURUSD (1.15): The Euro is starting to ease back from the highs of 1.17 after staging a strong rally on break of 1.1133. Price broke the previous resistance at 1.148 – 1.144 and briefly touched the upper end of the rising price channel. The current retracement is likely to see a correction to the broken resistance of 1.148 ahead of further gains. There is a potential risk of a further decline back to 1.1133 – 1.12 region as well in the event the resistance gives way. Regardless of whether EURUSD finds support at 1.148 or lower at 1.12, the bias is now to the upside as long as prices are trading above the main level of 1.10 – 1.1097. To the upside, an unfilled gap from 2nd January 2015 remains the most likely point of test to the upside.
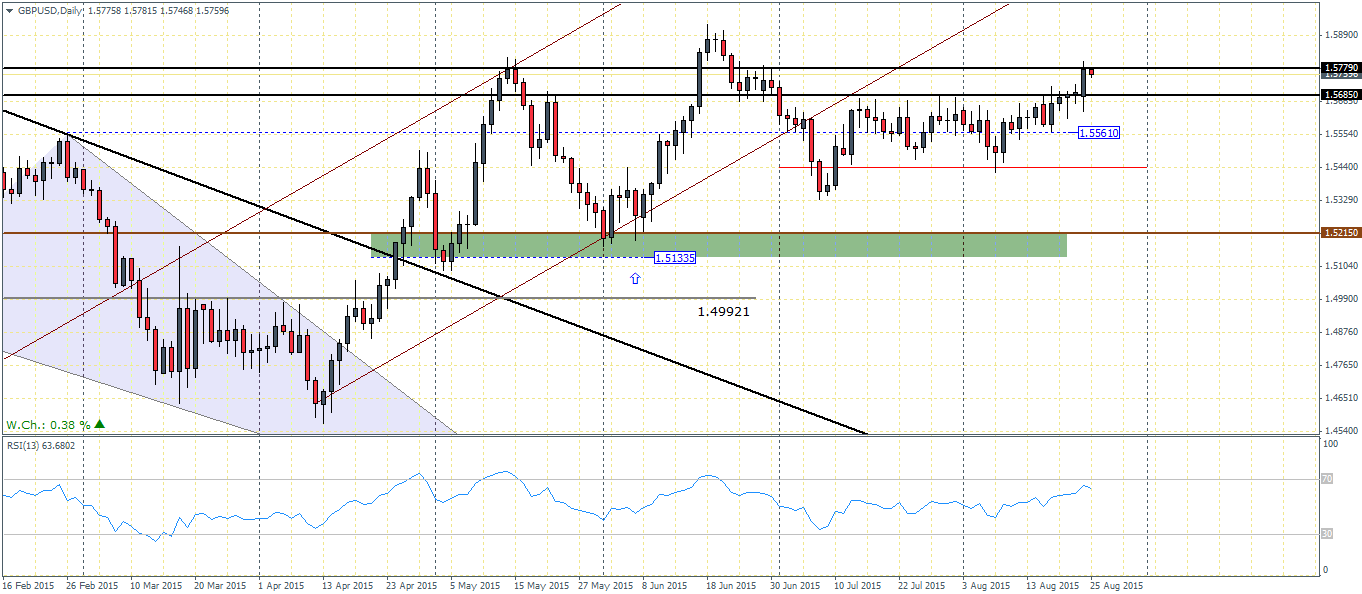
GBPUSD (1.57): GBPUSD has not moved much in recent days despite the modest break of the upper range limit of 1.5685. Price action however rallied to the main resistance zone of 1.5779. We could expect to see some declines in the short term with a test back to 1.5685, range highs. Prices are supported as long as Cable trades above 1.5561 level of support. A break below 1.5561 could see a test back to the lower end of the range at 1.544 which could then put the risk of a further downside towards 1.5215. A break above 1.5779 will however shift the bias to the upside as GBPUSD could attempt to test the previous highs and round number of 1.60

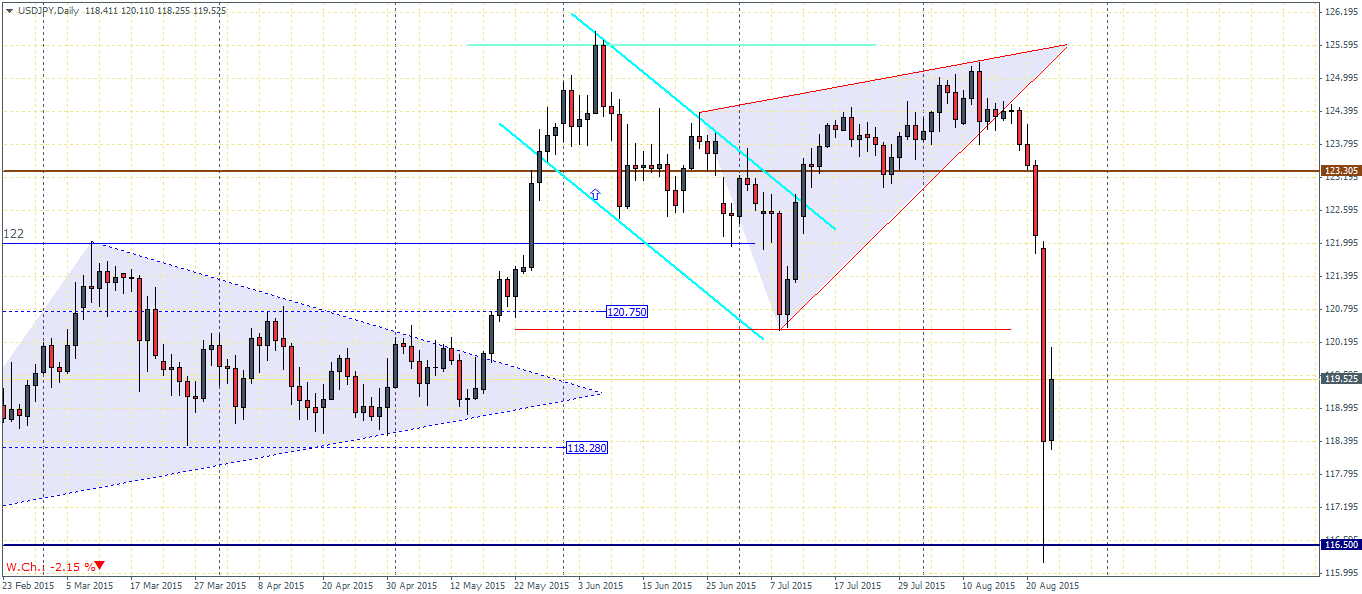
USDJPY (119.3): USDJPY has fallen off the rising wedge/triangle pattern and went into a free fall after the main support at 123.3 was broken. Price rallied lower and also tested and broke the next support at 120.42 to test fresh lows of 116.5 before easing back higher. The correction to this decline could now face a test of resistance at the broken support of 120.42, in which there could be a further downside in store. If resistance at 120.42 holds, USDJPY could break below 116.5 and possibly test the unfilled gap at 112.288. We however do not rule out a higher test of resistance at 123.3
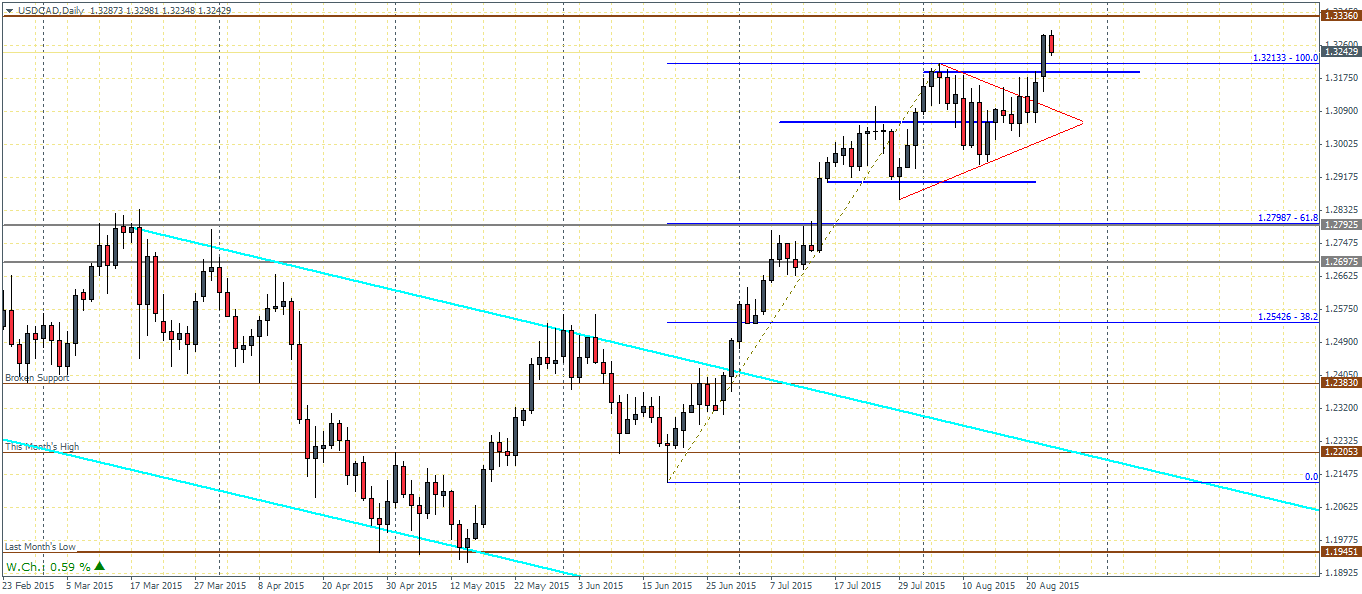
USDCAD (1.32): USDCAD continued to trend higher despite the USD weakness, indicating that the CAD is likely to weaken further. Price broke previous highs above 1.3175 and any declines are likely to be supported at this level. To the downside, in the event of a break below 1.3175, we could expect a test back to the previous range high of 1.30595. The strong support levels below are likely to see USDCAD continue to trend higher with an eventual target to 1.3336. Traders should also note the bullish pennant pattern that has formed which puts further upside in USDCAD with an eventual target to 1.3884, but subject to clearing resistance at 1.3336 which is a multi decade resistance level.
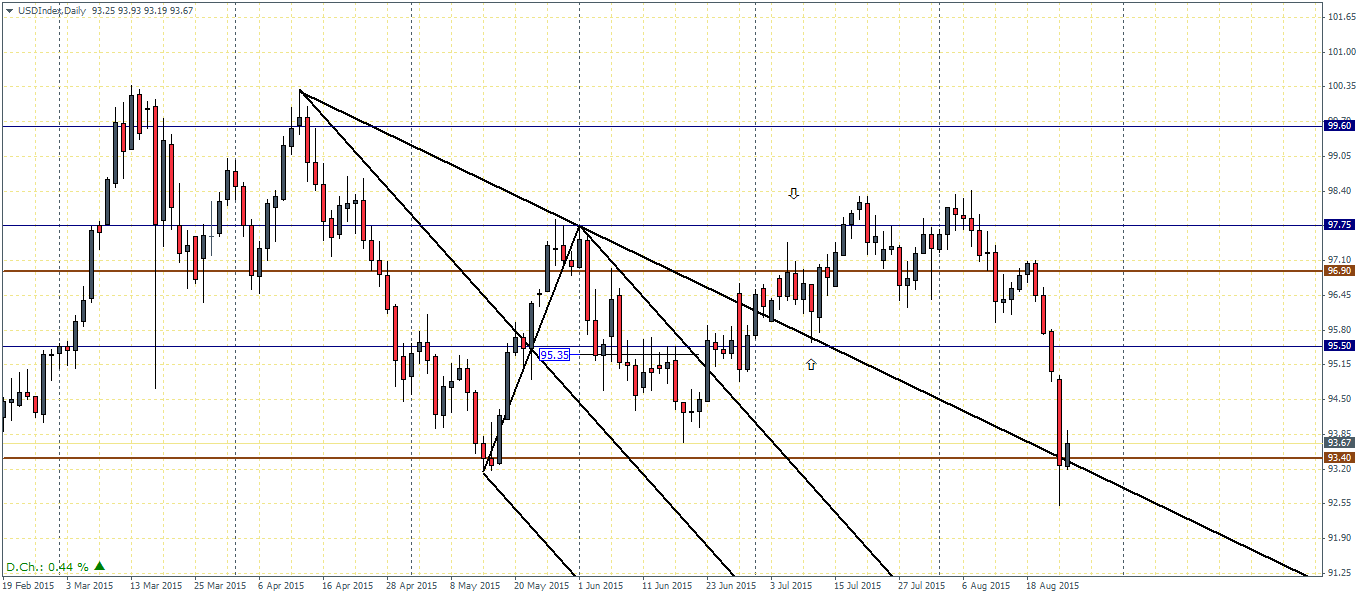
US Dollar Index (93.6): The US Dollar Index suffered significant losses after prices broke down from 96.90 support and eventually the lower support at 95.5 proved to be fragile to hold the declines. Prices have now fallen to the main support previously identified at 93.40 and the bounce off this level is well justified. The correction could see the US Dollar Index rally to as much as 95.50 resistance and could under exceptional circumstances test the previous broken support at 96.9 for resistance. To the downside, a break below 93.4 could prove to be very bearish, but for now the support could hold.