
The US Dollar Index has been trending lower for the past six daily sessions. The declines come at a time when investors weighed the July jobs report in the context of the Fed’s rate hike which according to the previous FOMC meeting noted that some improvements were needed to assess the possibility of a rate hike in September. While the jobs report was largely stable, it did little to boost investor confidence for a rate hike in September.
Earlier this week, the markets got a surprise from China as the Yuan was devalued for three days in a row. While the US Dollar initially surged on the news, it failed to hold on to the gains and continued to drift lower. The currency devaluation from China comes at tricky time when markets weren’t generally confident of a rate hike from the Fed and further complicates the timing of the rate hike in light of the latest moves from China.
During the week, Fed vice Chairman, Stanley Fischer in an interview with Bloomberg noted that inflation in the US was stubbornly low in comparison to the growth in the labour markets. His dovish comments reminded the markets of the Fed’s dual mandate which is to ensure price stability and full employment. However, the current economic situation so far shows that while the US economy is getting closer to full employment, inflation has failed to move alongside, thus risking the prospects of a September rate hike.
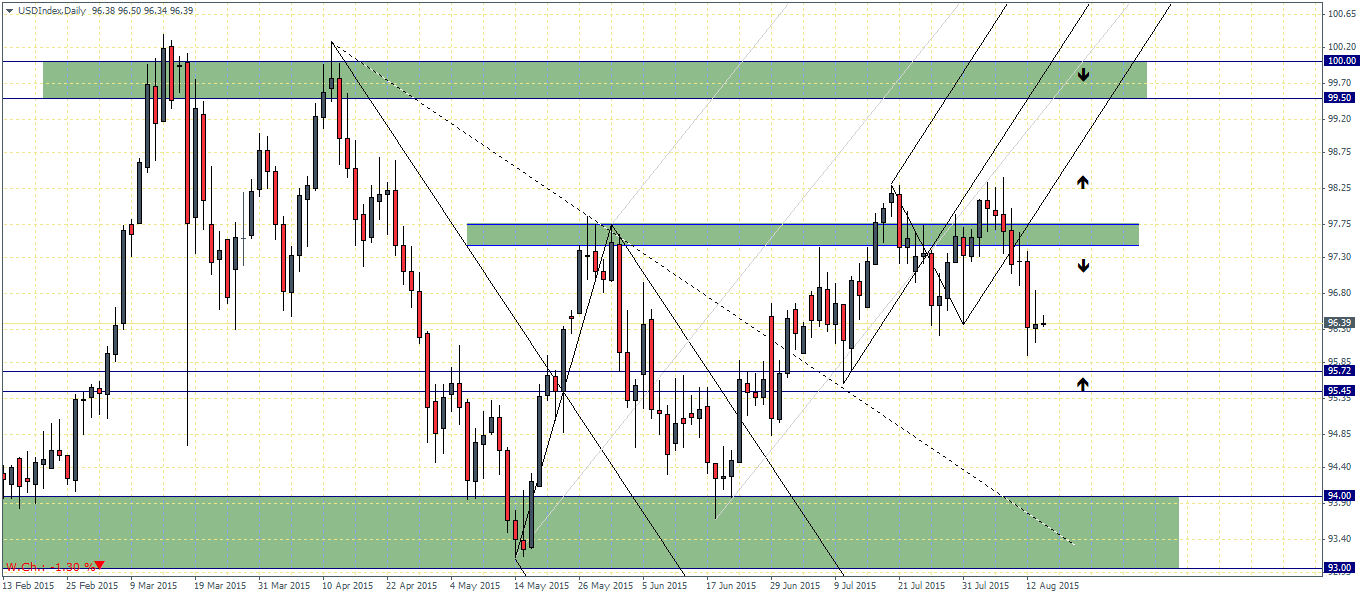
US Dollar Index – Technical Analysis

The US Dollar Index is down -1.3% for the week at the time of writing. The declines come as price action broke below the support level of 97.75 – 97.5 which we noted in last week’s analysis. It also indicates a break out from the rising median line. Price action is currently seeking to consolidate near the minor support formed at 31st July lows near 96.38 – 96.45 region. This support level sits just above the major support at 95.72 – 95.45. While we can anticipate a potential bounce off the current minor support, the US Dollar Index could inevitably decline lower to test the previous support at 95.72 – 95.45 region.
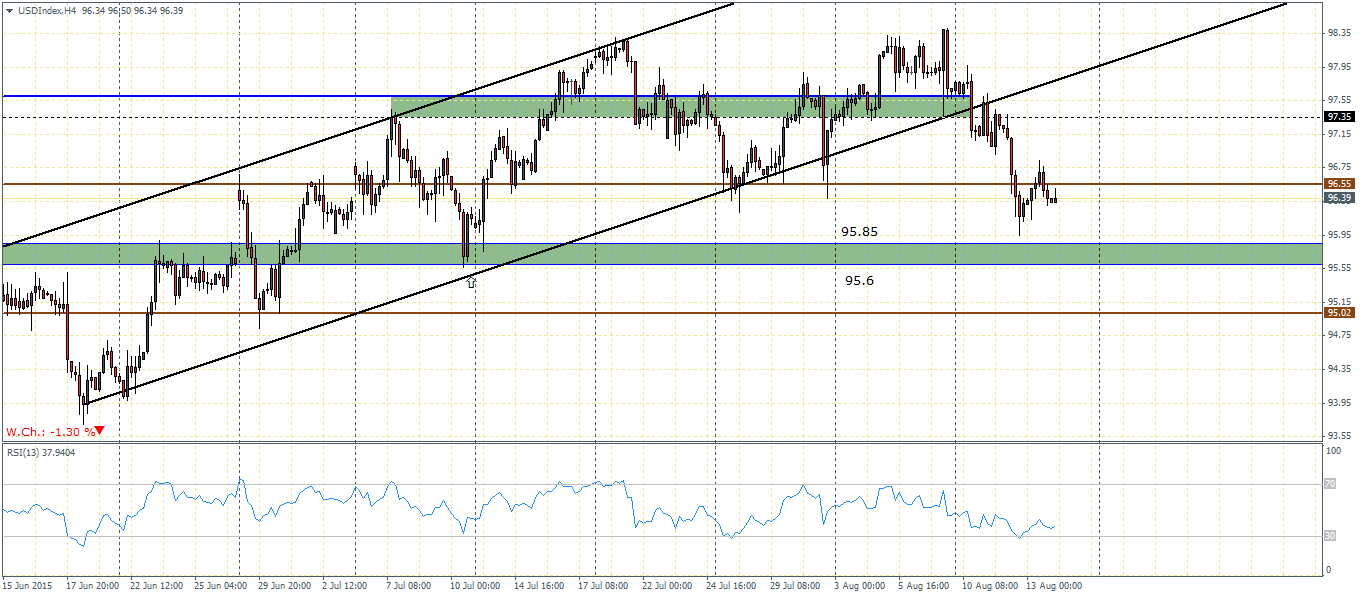
On the 4-hour chart time frame, the declines were marked by a downside break out from the rising price channel. We notice a minor bounce back to the 96.55 region of support/resistance but the declines could see a test of support near 95.85 through 95.60. Price action at this support could prove to be crucial as failure to support prices could spell further weakness in the Greenback.
Looking ahead, as far as the US economic data is concerned, it was a relatively quiet week. Retail sales managed to come in line with estimates on both the core and headline but it did little to boost investor confidence in the US Dollar. The markets will be expecting to see the Producer Price Index data due later this evening which could give a glimpse into the future inflation prices. Also on the agenda is the UoM inflation expectations and consumer sentiment, which is known to swing market sentiment on a surprise print. However, all said and done the Greenback could be looking to close this week on a bearish note ahead of the FOMC meeting minutes due next week.

