
Gold futures remained subdued since early this week despite the major global equity rout. As investors sold off the riskier equities and the currency markets saw a flight to safety with the Yen and the Swiss Franc gaining ground, the precious metals markets however did not move much. The rally in Gold which we noted since the past week however is looking to come to an end with Gold declining since Tuesday this week after prices briefly tested the highs above 1165.7. For the week, Gold futures are down -2.10%.
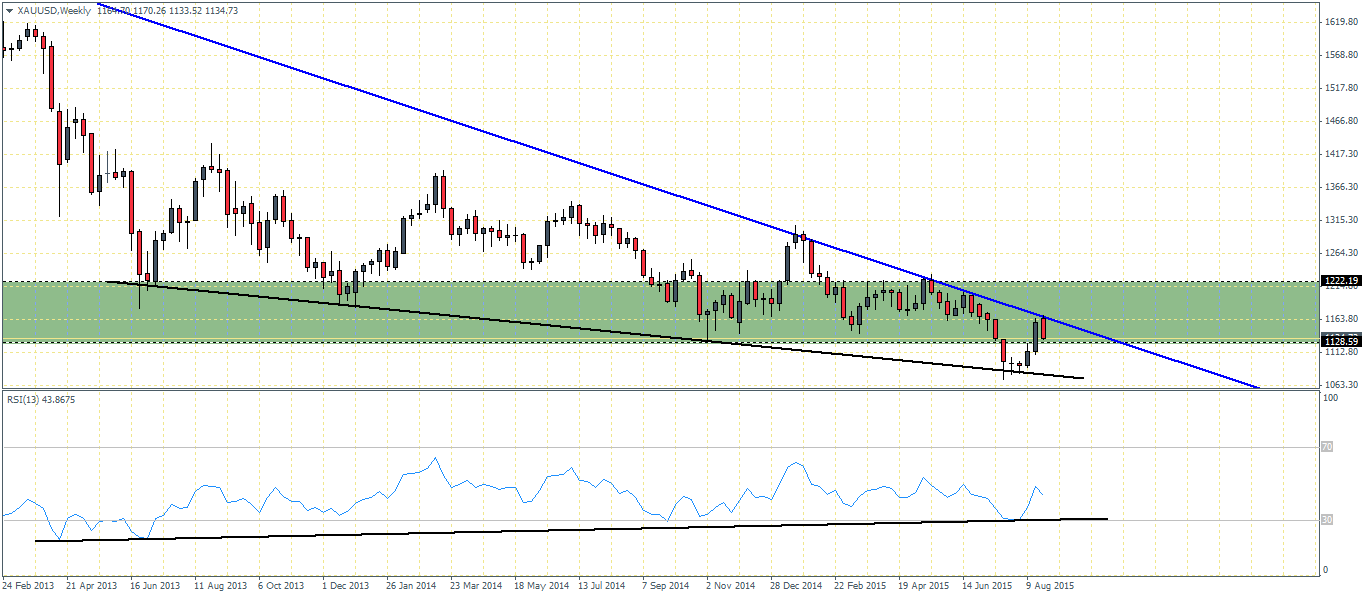
On the weekly charts, we notice that the rally ended after a test to the falling trend line near 1163 region. The bearish reversal we are seeing on the weekly charts could see a potential decline to 1127 – 1130 level of support. A break below this support could see Gold fall further towards 1100 region. A break below 1100 will potentially see Gold futures start a new leg in its declines and could see prices fall to historic lows. We would however need to see a confirmation of a bearish close on the weekly charts in order to ascertain the downside bias.
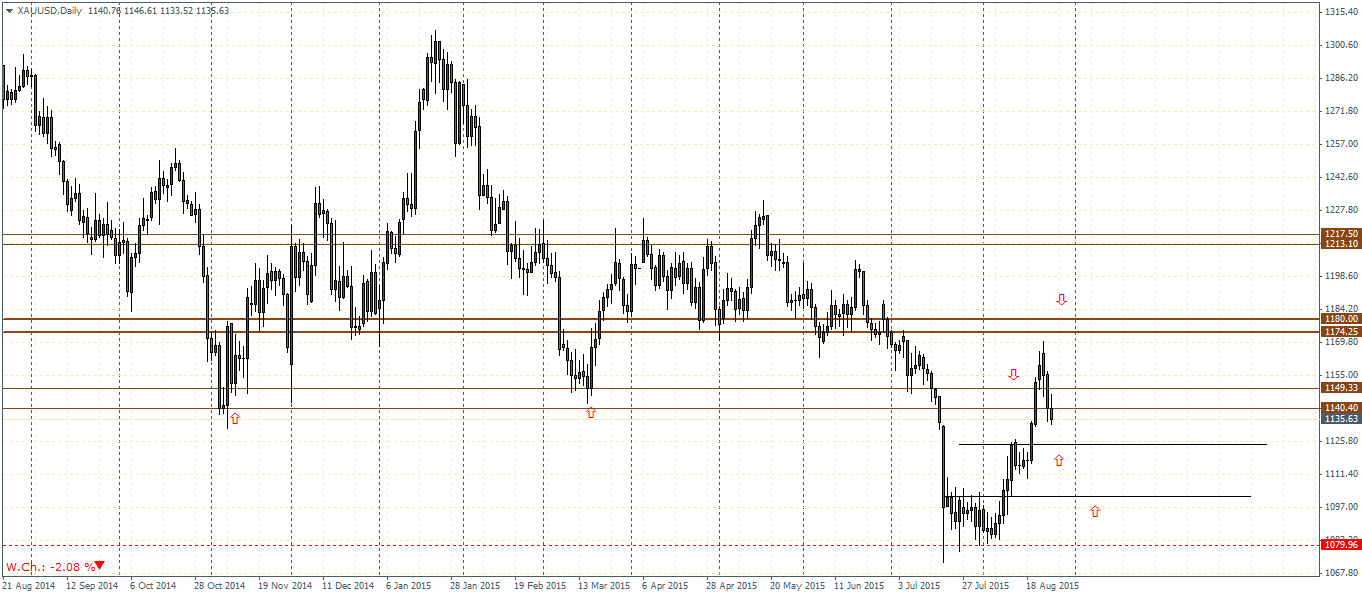
On the daily charts, the price action is more evidenced, as we see that prices failed to hold on to their gains on breaking above the support/resistance level between 1149 – 1140. This indicates a possible decline lower with the next main support coming in at 1124 and 1100. If any of these two lower support levels manage to hold the declines, Gold futures could attempt another rally to the upside to test the level of 1149 – 1140 for resistance.

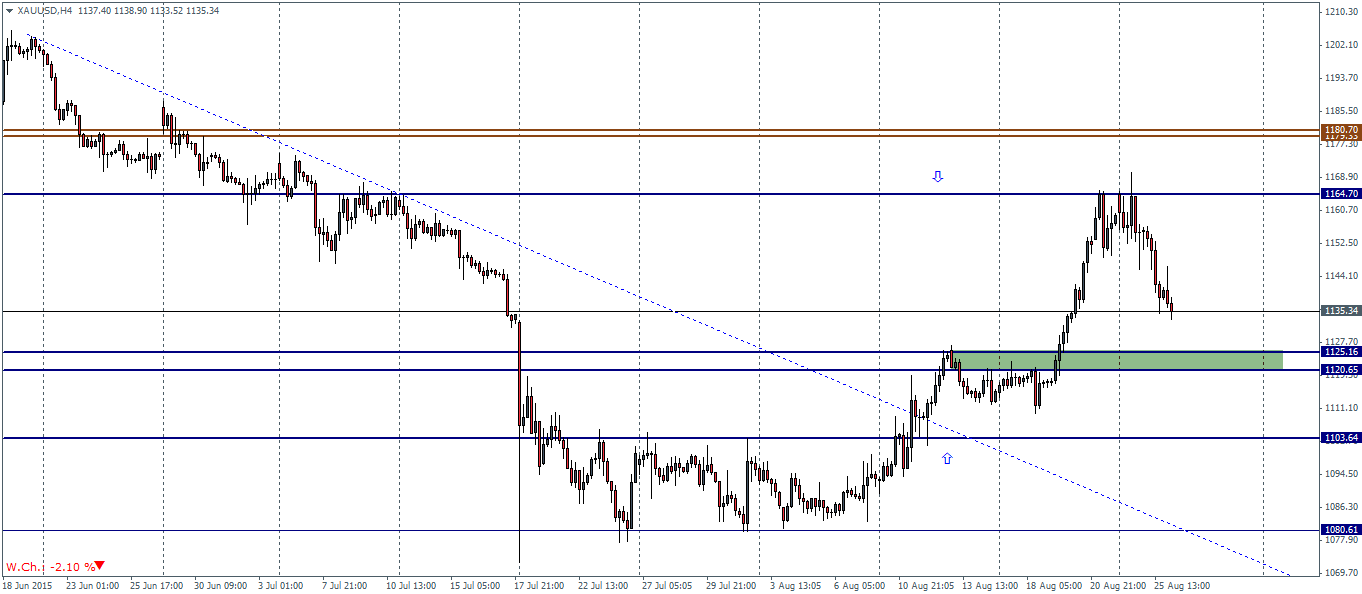
Last but not the least, the support levels are clearly seen on the 4-hour chart where the support level between 1125 – 1120 could be an ideal level for prices to reverse their losses. Below 1120 support is the next main level at 1103 – 1100.
Silver futures have remained bearish ever since the test to 15.5 level of resistance which is also the neckline of the head and shoulders pattern on the daily chart. Price is back to the previous lows of 14.58 and a close below this support is needed to see further declines in Silver. For the week, Silver is down -4.6% marking a very bearish week.
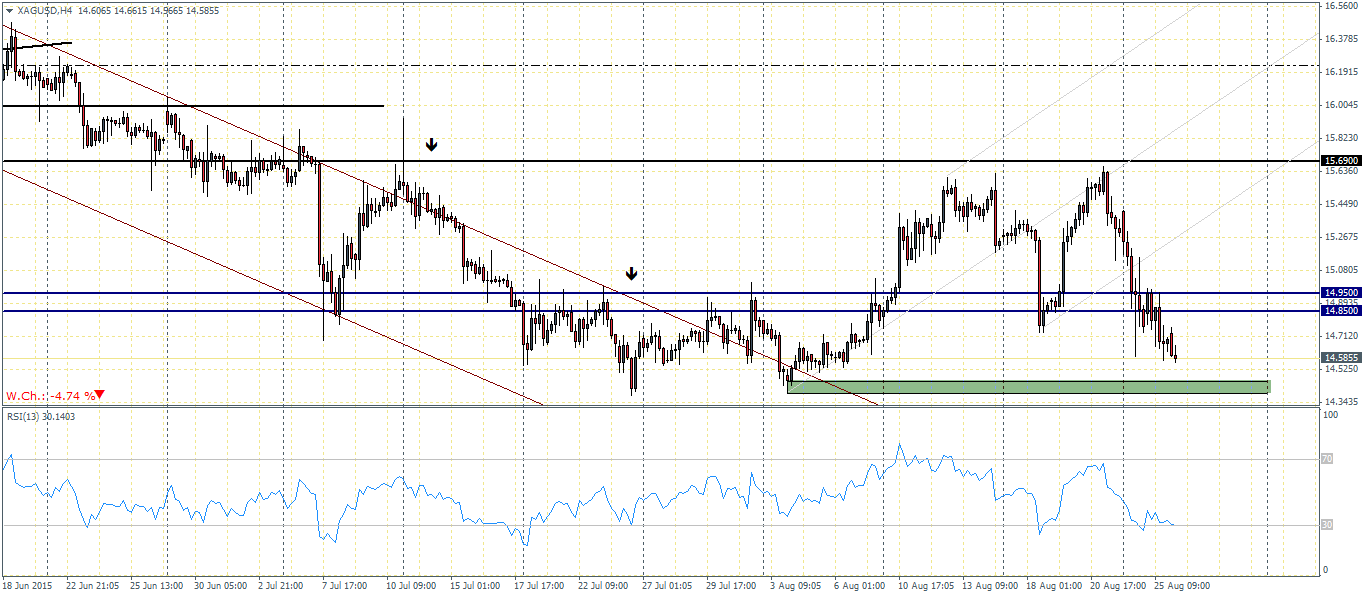
On the 4-hour charts, Silver prices have managed to break below the support level of 14.95 – 14.85 with the next lower minor support coming in at 14.52. A close below could push Silver to new test new historic lows. Plotting the median line, we can see the reversal off the median line which resulted in a sharp decline and prices look certain to test the lower support between 14.5 – 14.35. We can expect to see some bounce off this lower support which could keep Silver prices to consolidate ahead of the next major break out.

