
The precious metals remain under pressure in an environment of uncertainty surrounding the US rate hikes. For the week, Gold was down -0.8% while Silver was down -1.57% at the time of writing. With the US Federal Reserve preparing for a rate hike in September, the markets are starting to turn increasingly bullish on the interest rate hikes which have put downward pressure on the commodity markets.
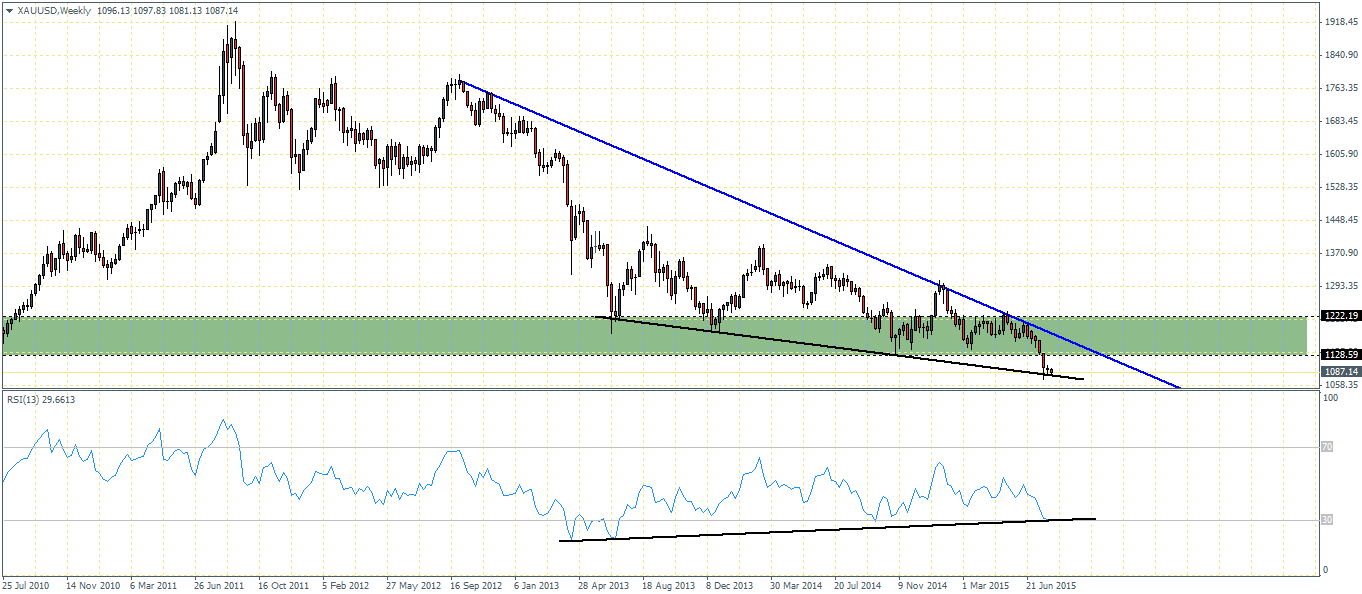
From the weekly charts, Gold futures have certainly clear the major support zone near 1222 through 1128. However the declines are not being confirmed by the RSI which currently is posting a bullish divergence, making a higher low while price is making a lower low. If the divergence is confirmed, we could expect to see a correction in Gold that could see the Yellow metal test previous support at 1128 followed by 1222.
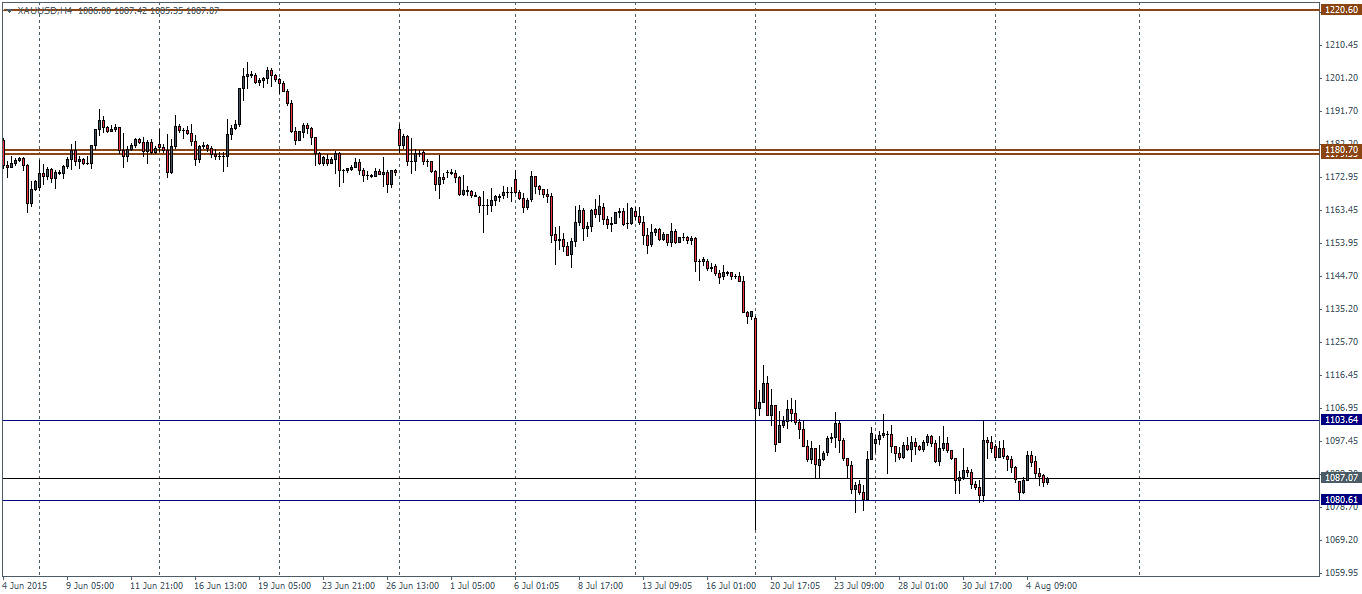
On the 4-hour chart time frame, Gold futures have been ranging for the past two weeks after a sharp decline seen few weeks ago. This could potentially signal either a continued decline on break below 1080 low, which could see Gold test as low as 1050, while an upside break above 1103 will see Gold correction to a minimum price level of 1128 – 1130.

Silver continues to trade weaker with the monthly chart showing a breakout from the ranging price action seen since late last year. The break below 15.45 could see further renewed bearish momentum take shape in the medium to long term perspective.
The daily chart for Silver shows the longer term head and shoulders pattern that was formed. With prices breaking below the neckline at 15.51, we expect the bearish trend to continue for a minimum price objective to 13.76.
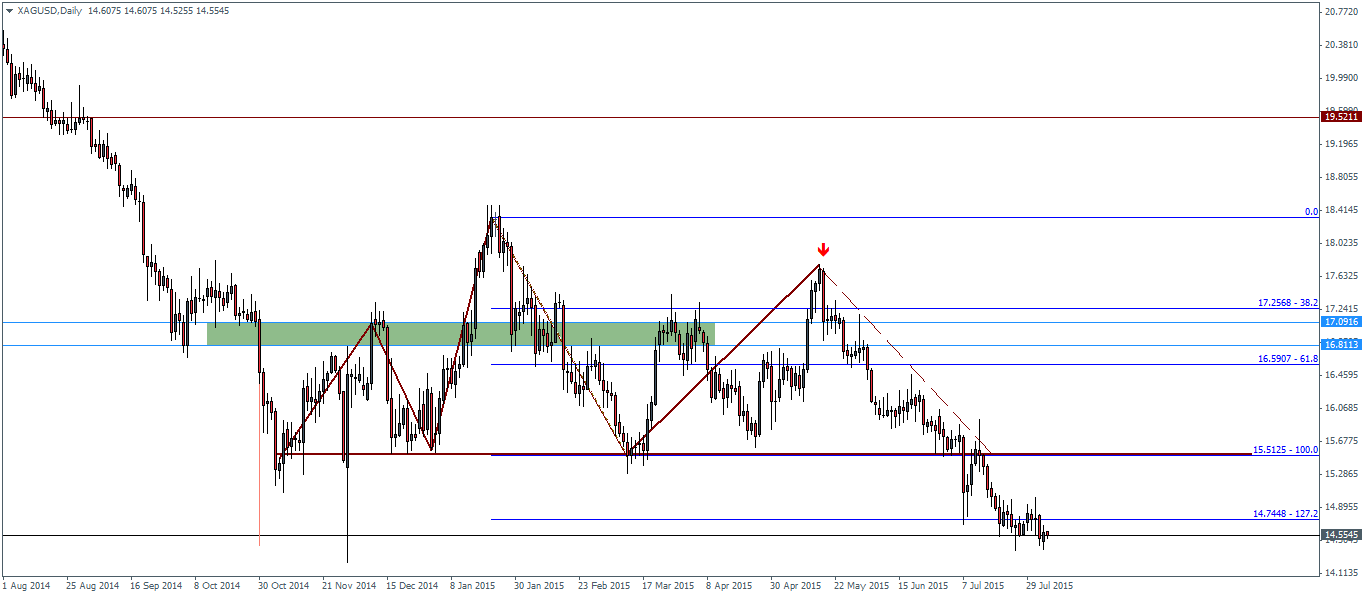
There is of course the possibility to retrace back to the neckline at 15.51 as an alternative view ahead of the eventual decline to 13.76.
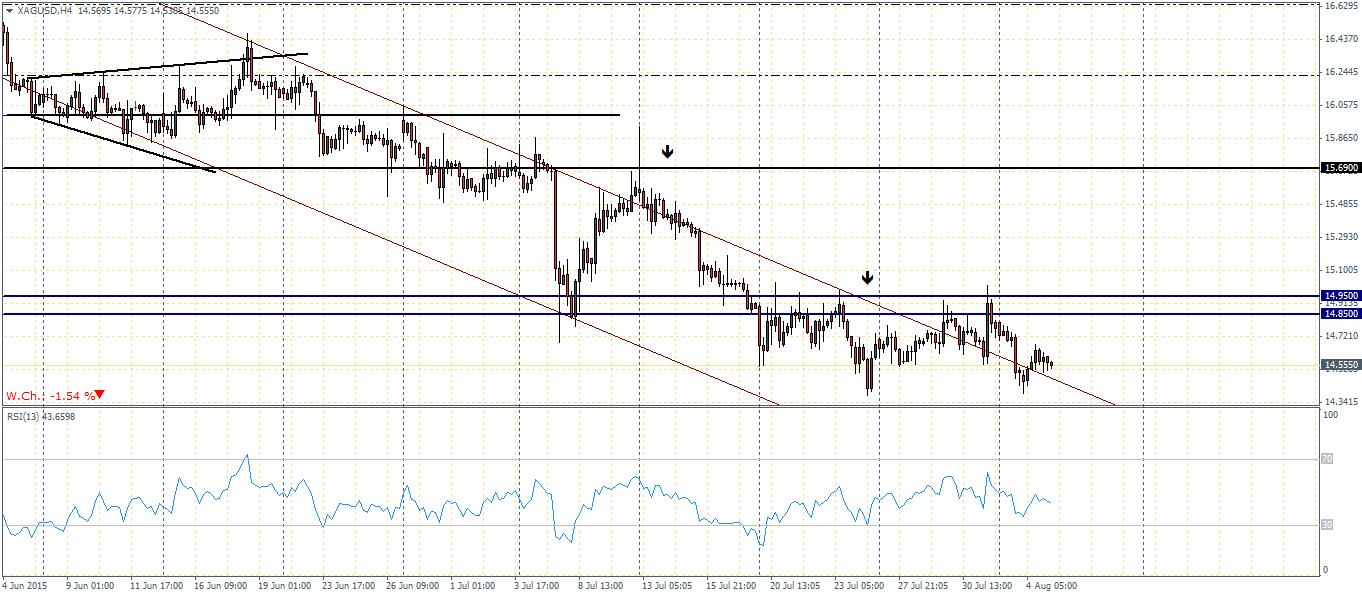
On the 4-hour time frame, Silver prices briefly attempted to break above the resistance near 14.95 through 14.85 but failed to do so, which saw Silver find support near the price channel’s upper trend line. We could anticipate another test to 14.85 region which if holds the price it could result in a sharp downward momentum being built up. However, should prices aim to break the resistance above 14.95 that could see Silver test the next main resistance at 15.69 through 15.51 which also marks the neckline of the head and shoulders pattern on the daily chart.
We will be able to get more clues after this Friday’s non-farm payroll reports are released. A beat on estimates on both the unemployment rate and the jobs numbers could no doubt see a sharp reaction in precious metals as they continue to be bid down. However, in the event that July’s payroll numbers disappoint, we can expect both Gold and Silver to embark on the correction which should offer a good price level for new sellers to enter the market.

![Credit Card 160×600 [EN]](https://assets.iorbex.com/blog/wp-content/uploads/2023/06/13144507/Blog-Banner_EN-Banner_160X600X2.webp)