Crude Oil falls to March 2009 lows as weekly inventories report shows a surprise build up in Oil stockpiles
Crude oil futures closed sharply lower yesterday losing -3.59% for the day. Oil futures fell to the lowest levels last seen in March 2009 as the weekly US Crude oil inventories report showed a surprising build up of Crude oil inventories. Oil prices closed the day at 40.89 after initially opening near 42.80.
The weekly crude oil inventories report showed an increase of 2.6 million barrels for the week ending August 14th against the analyst expectations of a decline in inventories by 1.2 million barrels. Even the dovish FOMC minutes which saw a risk on sentiment take over the markets weakening the US dollar did not help much as Crude Oil saw an overwhelming bears enter the markets. With prices closing below the main technical support lows near 42.39, we could expect to see further downside in store as it looks increasingly evident of further continued decline with the possibility of testing $32.5 very much a possibility.
Crude Oil Technical Analysis

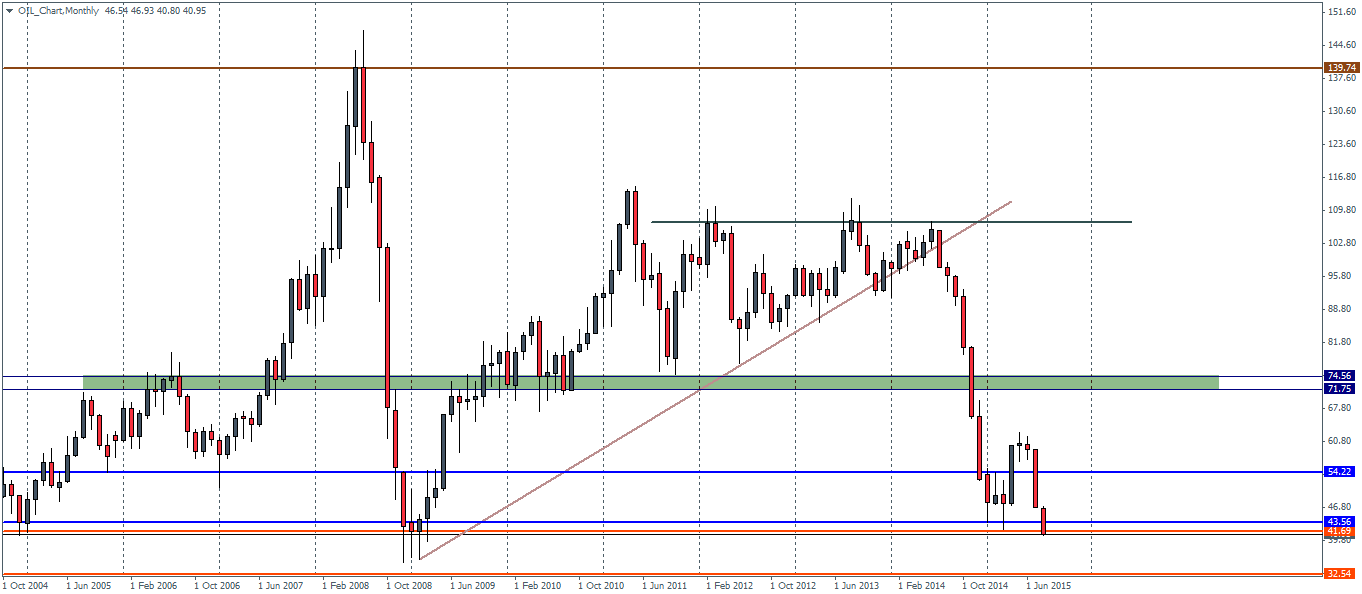
The monthly chart for Crude oil futures shows a very bearish outlook as prices currently trade near the lows below 41, last seen in October 2008. A monthly close below the $41.7 handle could push Crude Oil to test the lows of 32.54. There is however a possibility that prices could find support at the current lows as it marks a region of strong support looking at the monthly charts. We would however need to see a more convincing set up before we can anticipate any turn around in prices.
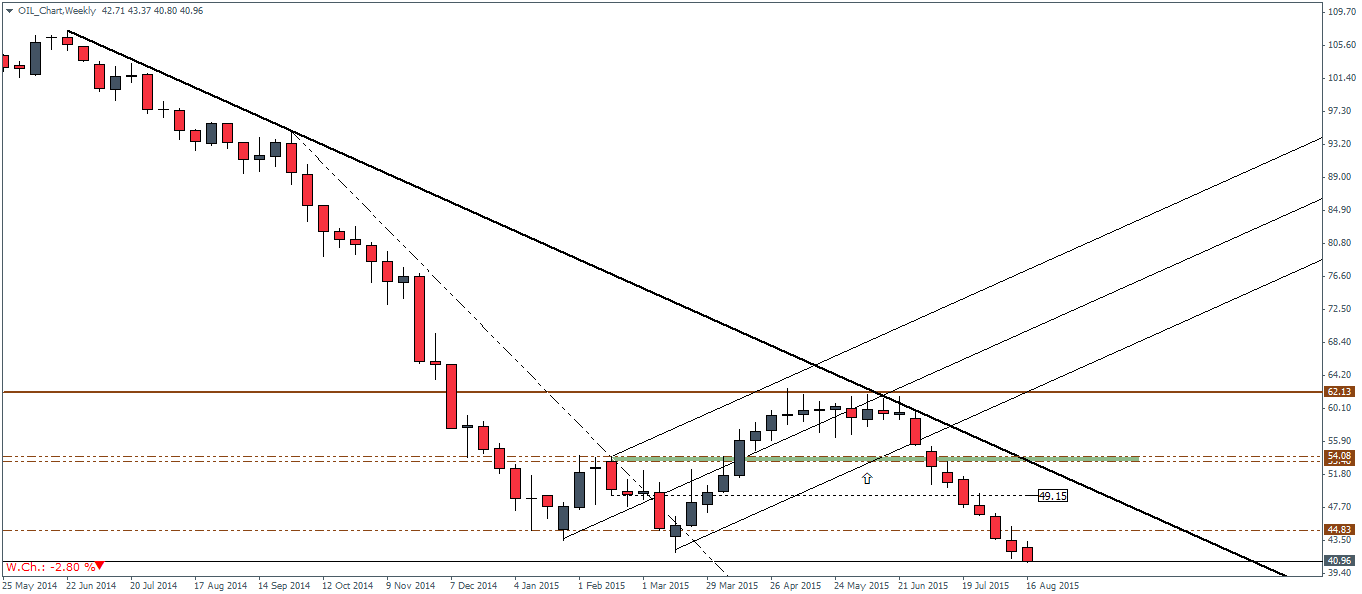
On the weekly chart for Crude Oil, price action has cleared the lower support at 44.83 after breaking the median line and the previous levels of support. In the event of any bounce, the correction in Crude oil could meet resistance at 44.83 in the medium term.
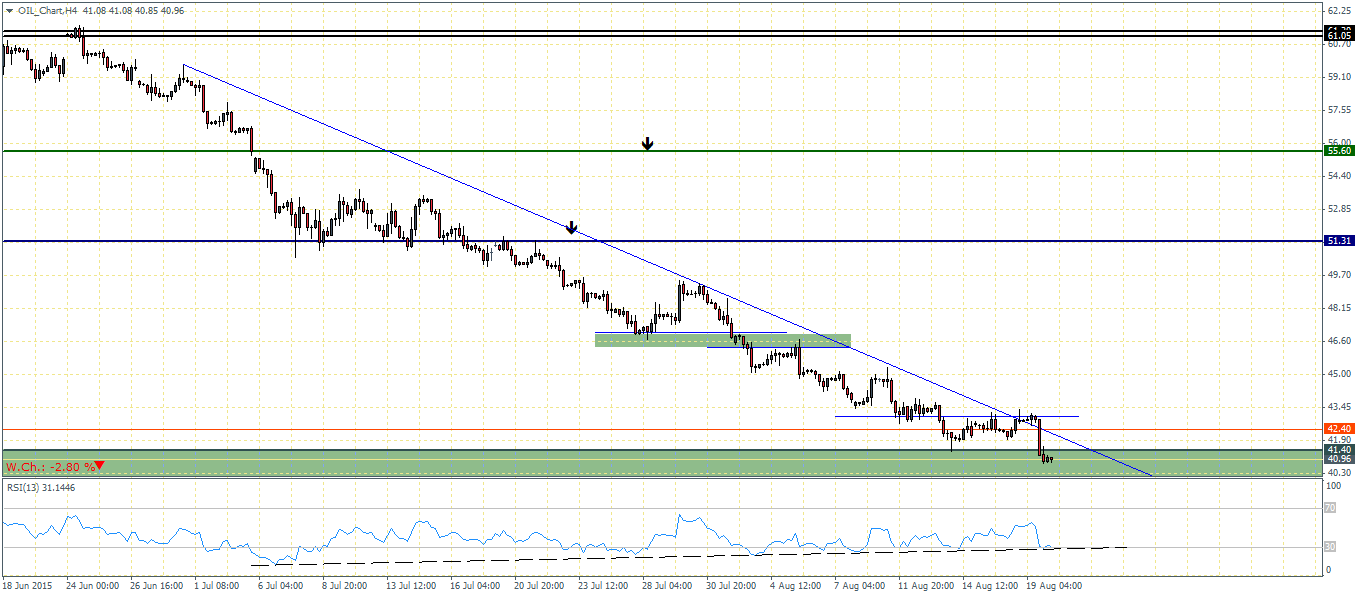
Lastly, the 4-hour chart for Crude Oil continues to show a bullish divergence being built up comparing to the RSI. Price action as we see now is trading in the support zone between 41.40 – 37.80. re-adjusting the previous resistance level, we could expect to see a correction if Crude Oil manages to close above the 42.40 level of resistance on the H4 chart and also closes above 44.83 level of resistance taken off the weekly chart time frame. This could potentially pave the way for a correction to 51.31. However, given the current circumstances, we expect a bit more downside to prevail before the correction starts. The falling trend line is something to bear in mind as a close above 41.40 with a break of the trend line could start to signal a correction in Crude Oil.