Crude oil futures remain subdued but a correction is due!
Crude Oil futures continued their decline this week with the commodity losing over -3% for the week. Crude is currently trading near the lows last see earlier this year in January. The decline in prices comes despite a fall in inventories, which showed Crude Oil stockpiles falling -4.4 billion barrels, compared to expectations of a decrease of only -1.5 billion barrels. The US Energy information administration also noted that US oil refineries were running at the highest rate last week since 2005.
A stronger dollar on hopes of a rate hike, slowing demand from China and Iran’s Crude oil hitting the already oversupplied markets were just some of the contributors to the price fall.
Fundamentally, the major risk to Crude Oil comes from this week’s US jobs report which will be closely watched. A better than expected US jobs report could further strengthen the US Dollar as it stands poised to test the psychological level of $100. Investors expect the US Federal Reserve will be hiking rates in September although subject to improved labour market conditions as noted in the FOMC’s July Statement.

Crude Oil Technical Analysis
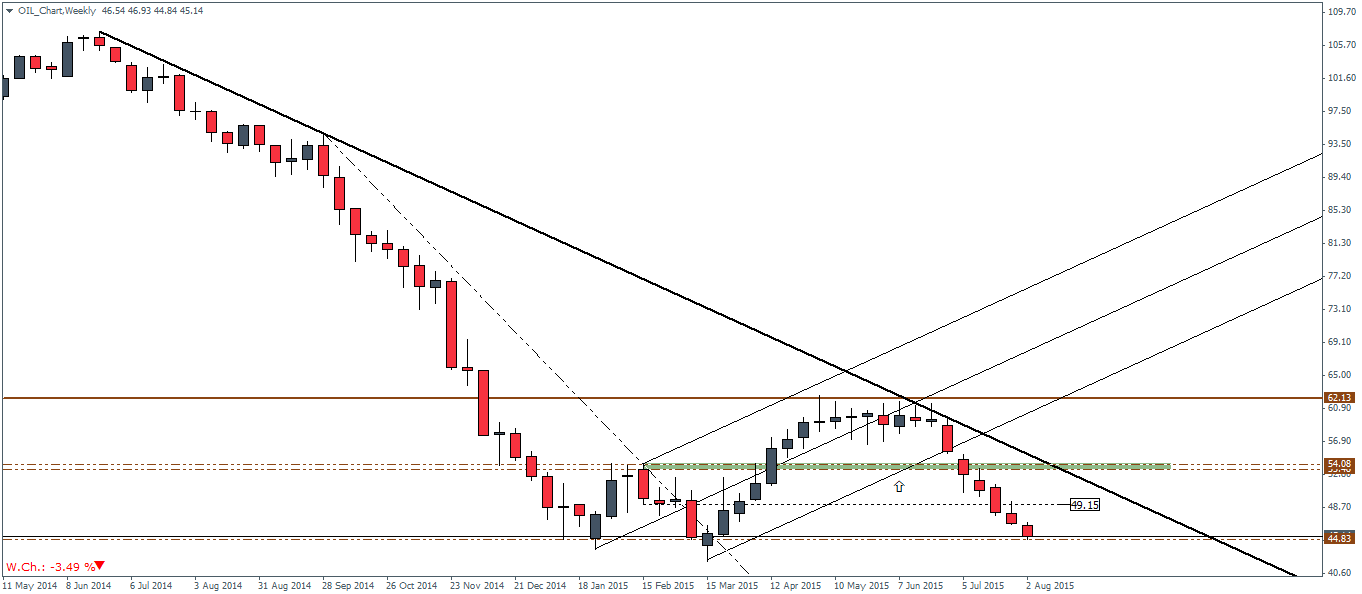
From the weekly charts, Crude Oil futures have continued their decline with strong momentum as the commodity is poised to test the previous levels near $44.75. The decline in Crude oil see’s close to seven weeks of declines after prices were trading sideways previously. From the longer term perspective, Crude oil will need to break below the previous lows in order to validate further decline, but on the other hand, the price zone near $44.75 could most likely see a bounce at least on the first test to this level.
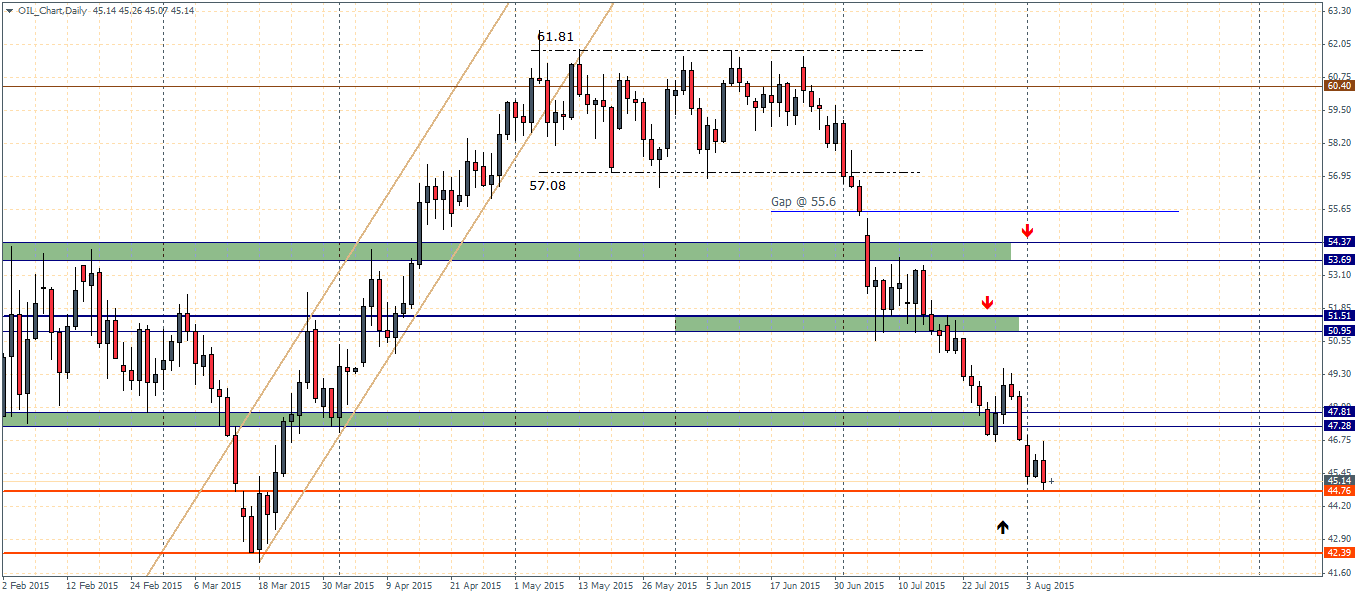
On the daily charts, we notice that yesterday’s price action formed a strong bearish engulfing pattern which comes right near the support zone of 44.76/75 through 42.39. This points us to the potential weakness to the downside that could ensue and one which could probably see prices decline further in the near term. However, there are many broken support levels that need to be retested for resistance. The first level comes in at $47.81 through $47.28, followed by $51.51 through $50.95 and eventually $54.37 through $53.69.
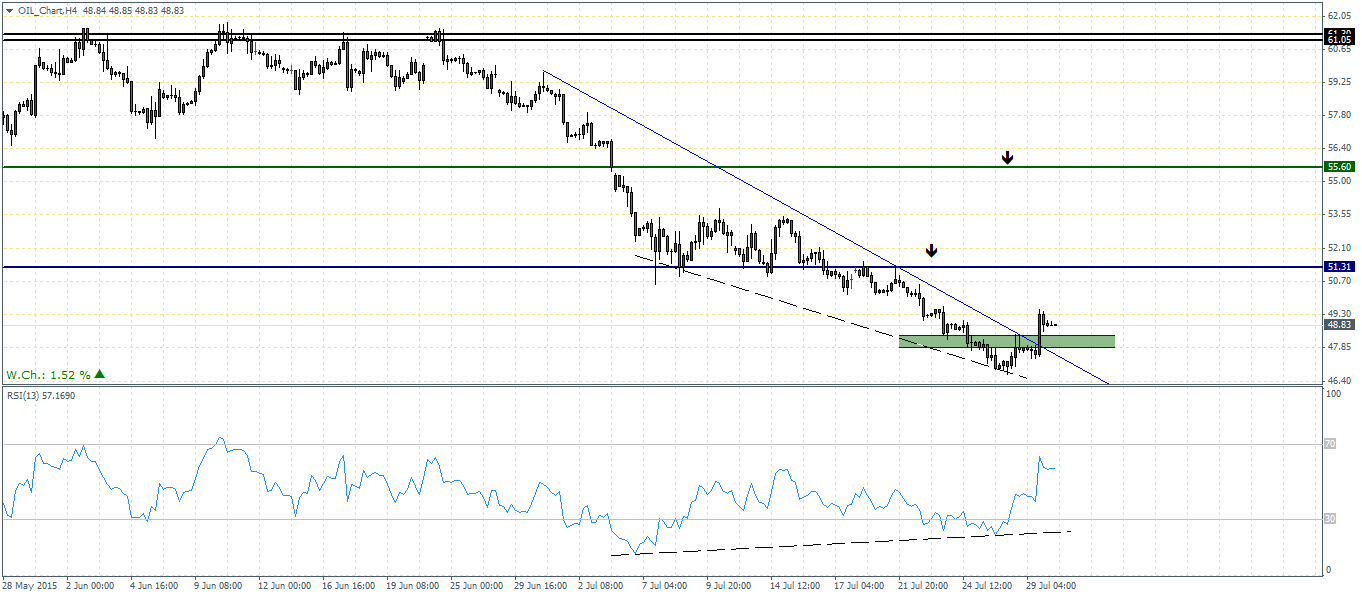
Finally, on the H4 chart, we notice a strong bullish divergence continuing to build up on the charts as the RSI is repeatedly failing to confirm the lows in price. The immediate support/resistance level comes in at $46.95 through $46.28. This price zone will be one to watch as a break above this level could set the stage for a sharp correction to the upside, with the minimum targeting being $51.31, which incidentally makes for the second resistance level noted from the daily charts with the potential upside risk taking price to as far as $55.60.