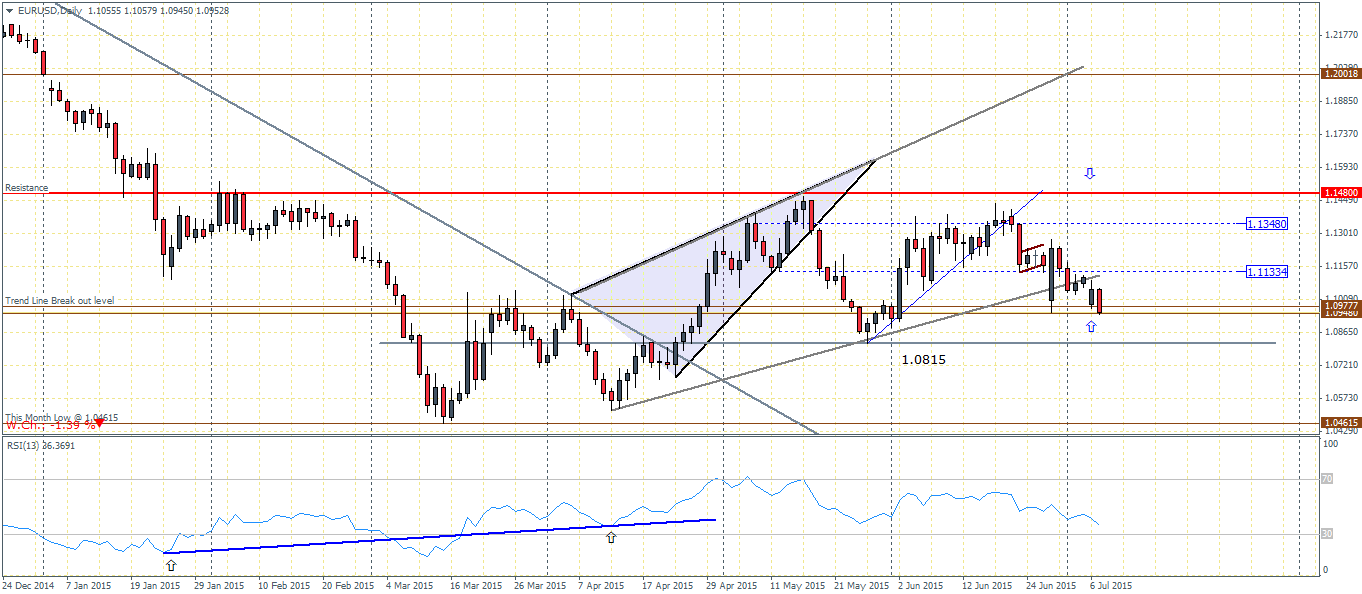
EURUSD(1.095): The Single Currency is back trading near the support zone, which previously saw a brief test to this level last Monday, 29th June. Back then price was immediately rejected at this level as we saw a strong rally back up, despite the weaker open. Close to a week later, EURUSD is now gradually declining back for a more clear test at this support at 1.0977 – 1.095. A decline below this support could see a test to 1.0815 region, while a close above the support could see the onset of a strong impending rally, which could see a test back to 1.148. The support at 1.0815 is the line in the sand as a break of this level could see EURUSD resume its bearish trend with the potential to break below previous lows at 1.04615 and possibly further.
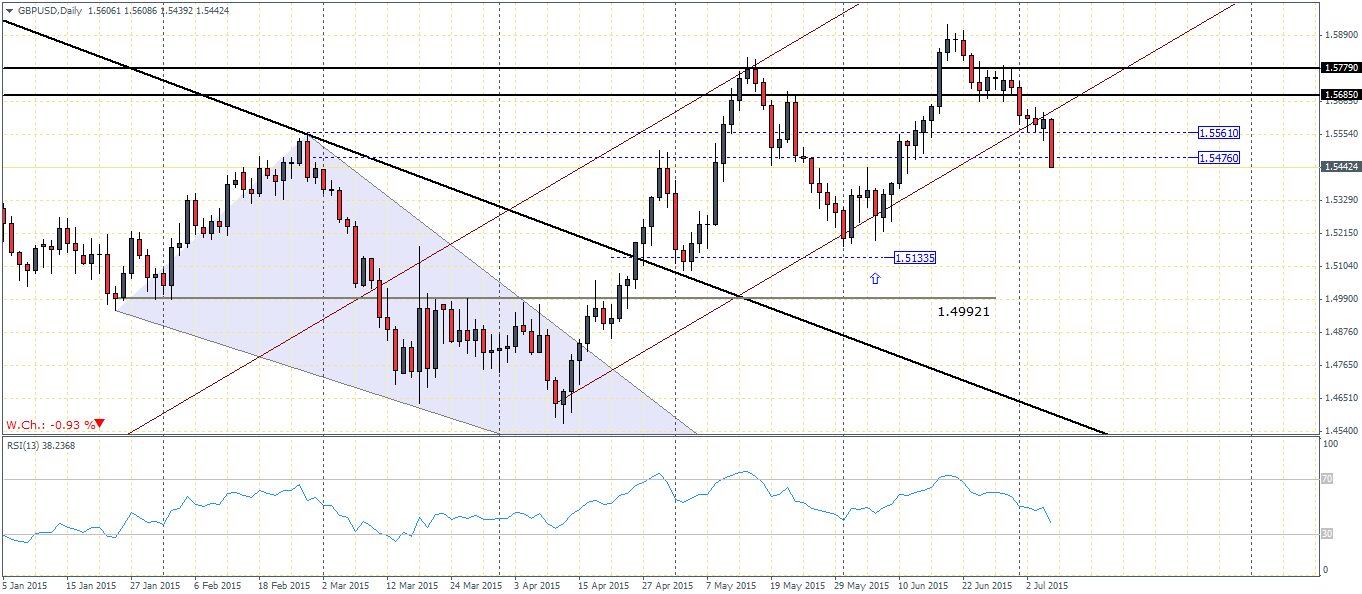
GBPUSD(1.544): The Cable continued its descent after breaking the main support at 1.5779 – 1.5685. Currently, price action is trading within the support/resistance zone of 1.5561 – 1.5467. If price action continues to decline, the next support at 1.51335 is very likely to be tested. We do expect a possible retest back to the current support/resistance level to establish resistance on the breakout level before the test down to 1.51335. Alternatively, to the upside, a close above 1.5561 will see price action turn choppy in the near term with the major resistance level looming overhead.

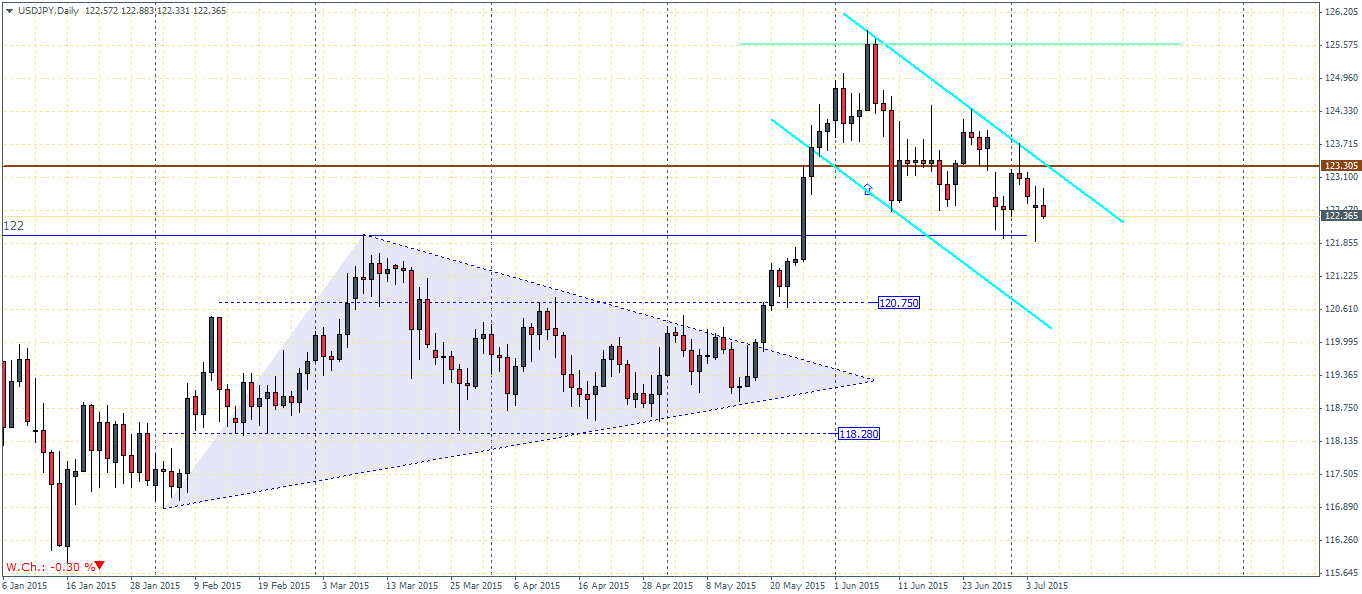
USDJPY(122.42): USDJPY looks close to testing the support at 122 after previous session saw a sharp rejection at this level. We therefore expect a cleaner test to 122 region. The major bull flag remains in place as long as 122 support does not give way. To the upside, resistance at 123.3 has to be tested for support in order to point to the bullish flag pattern’s rally. To the downside, a close below 122 could see a test to 120.75 support and could invalidate the major bull flag pattern.
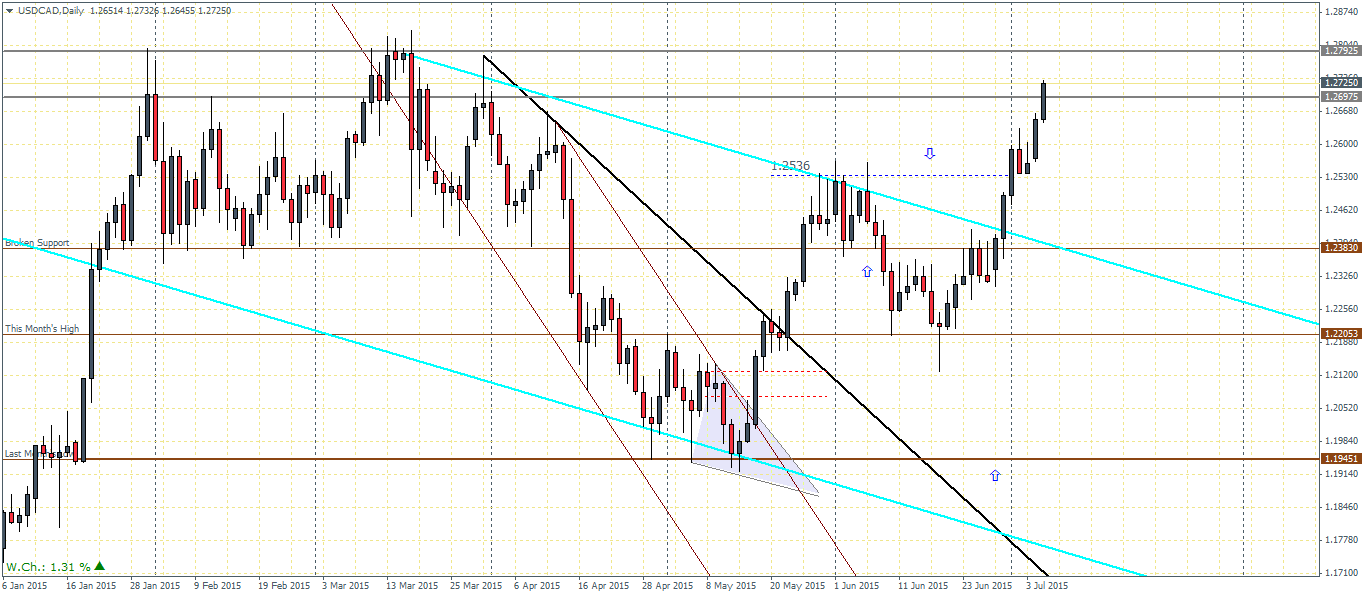
USDCAD(1.273): USDCAD is trading above 1.27 after price managed to break free of the resistance near 1.2536. A retest to 1.27925 cannot be ruled out in the current leg of the rally. This would make it the third attempt to break the resistance at 1.28 region. Failure to break the resistance at 1.28 could see a strong decline towards the support at 1.2383 (1.24, rounded off) region, which also marks the break out level from the falling price channel
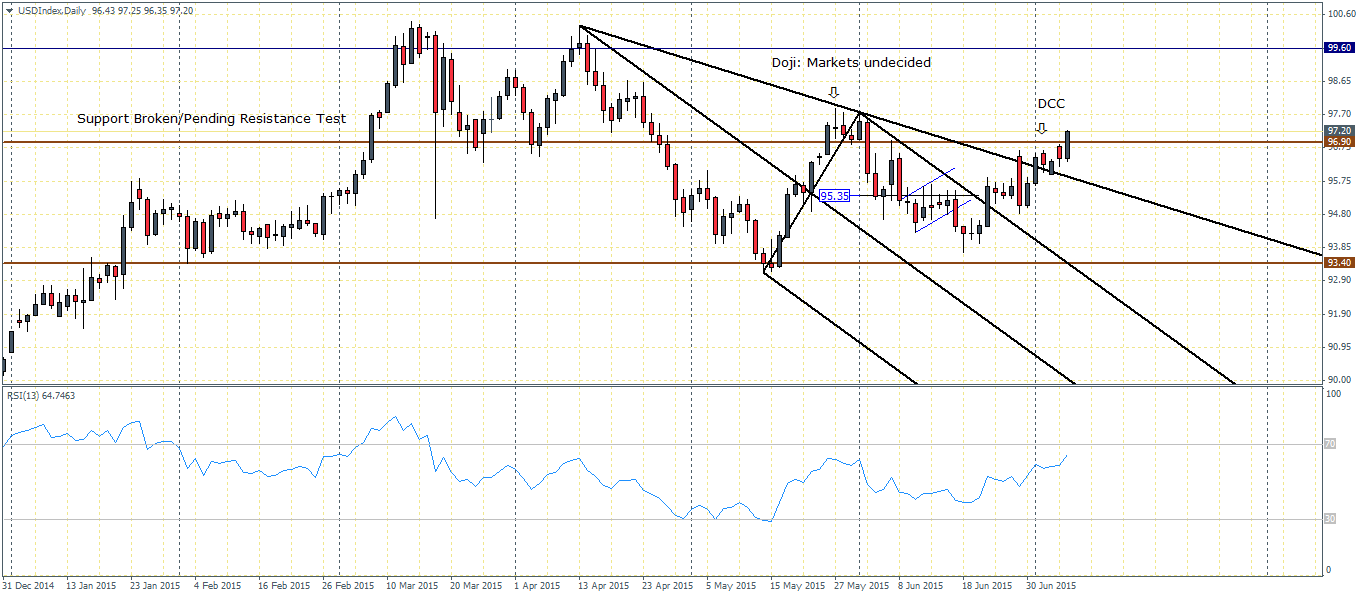
US Dollar index(97.19): The US Dollar Index has broken out from the falling median line and is currently trading above the previously broken support at 96.90. A daily close with a bullish engulfing candlestick pattern here could see the Dollar index test 97.70 resistance. Only a close above 97.7 will indicate the bullish rally being resumed in the Dollar Index, with the next potential resistance at 99.6.
Alternatively, failure to close above 96.9 or 97.7 will likely see the Greenback decline lower to test the previous support level at 93.4