Precious metals were mostly muted this week despite the various geo-political risks out of Eurozone on account of the Greece crisis and the flash crash in the Chinese equity markets. For the week, Silver futures were currently down -0.57% while Gold was flat, unchanged at 0% for the week.
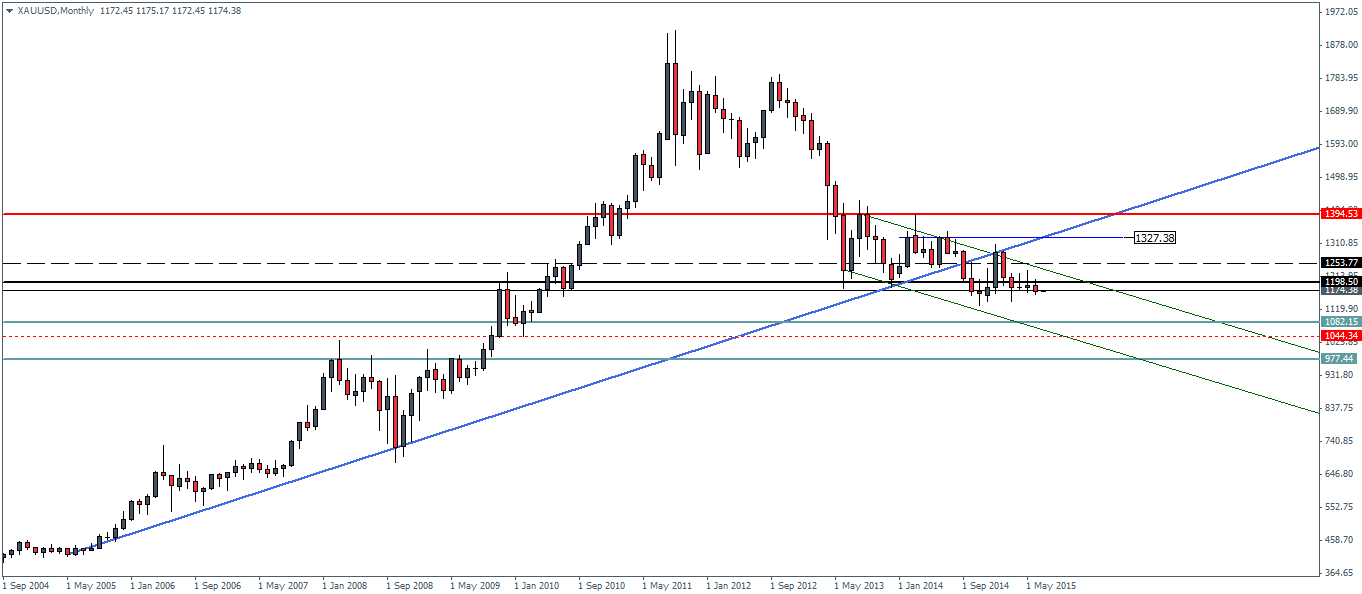
Starting with the monthly charts for Gold futures, we notice that the month of June saw Gold prices turn modestly bearish, closing on a bearish engulfing note. The fact that this price action pattern comes just below 1198 support from the monthly charts indicates that further downside is yet to come, with the potential to drop to 1082.
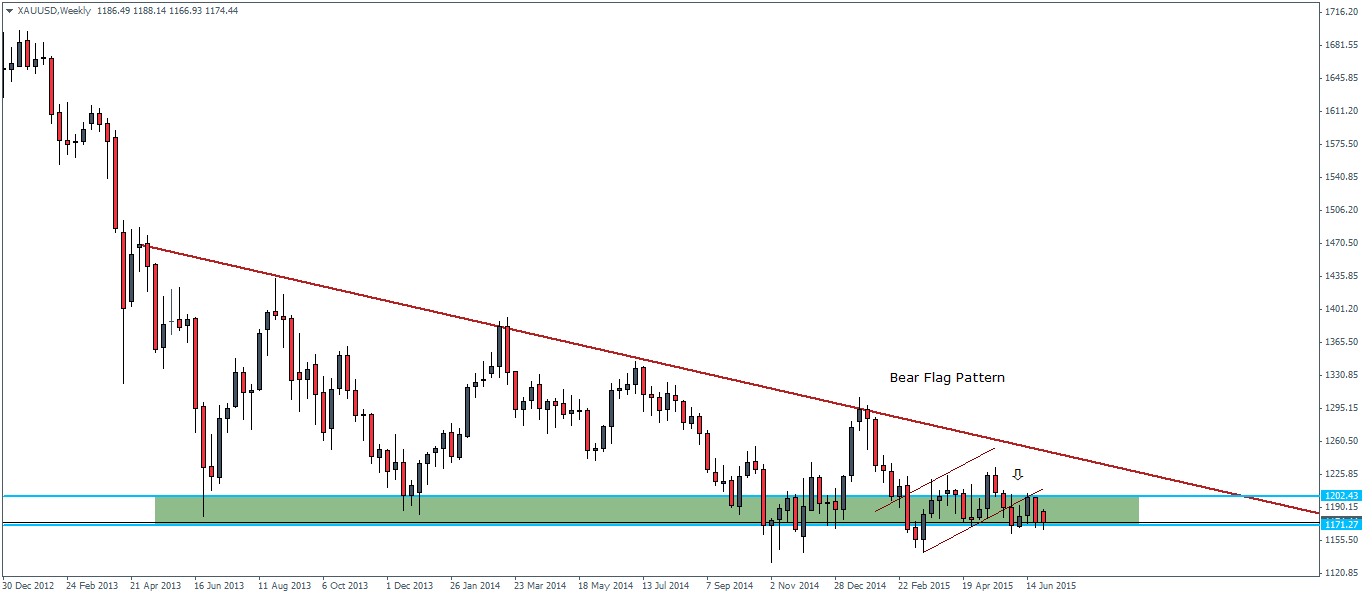
Switching to the weekly time frame, it is evident that after a brief consolidation on breaking the bear flag, price action now looks certain for further losses. The minimum objective should Gold prices break below 1156 is 1071.

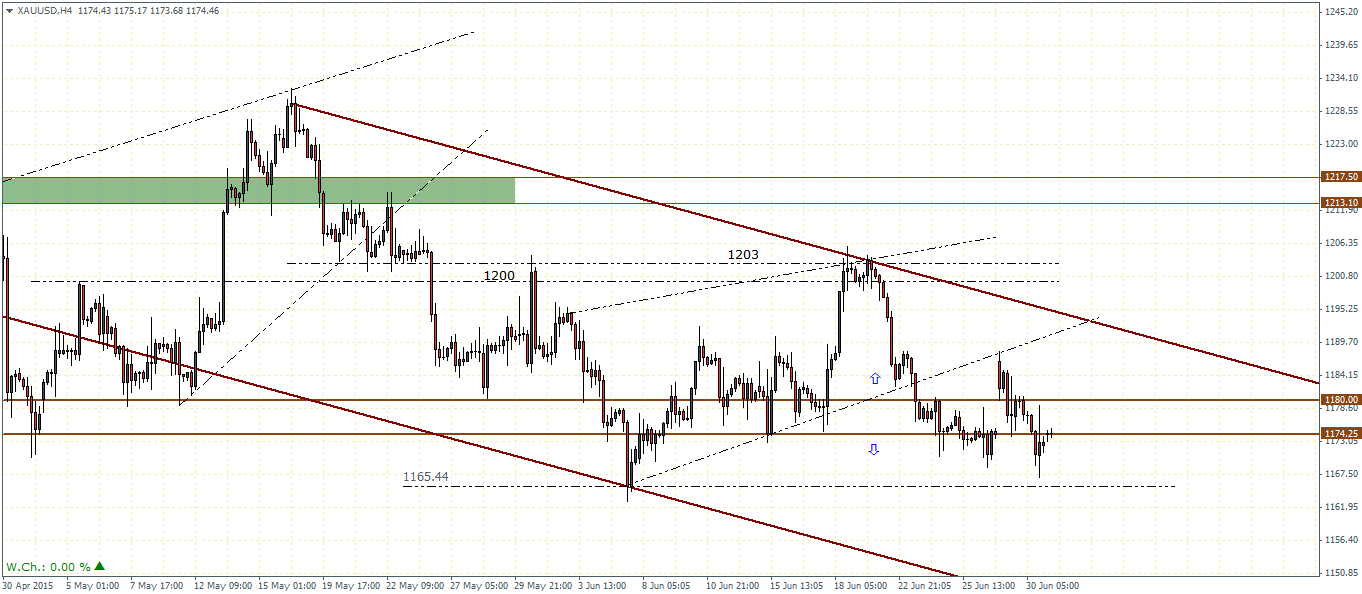
On the H4 charts, the price action is more evident as we notice a more recent break down from a rising wedge pattern, which also saw a brief retest to 1185 before declining lower. With the lower support at 1180 – 1174 being broken, we could expect the current consolidation at these levels to last for a little while longer before the downside strength sets in. On the H4 charts, the price level of 1165 is important to watch as a close below this level could indicate the onset of a fresh leg of selling, which could eventually see Gold prices drop to 1071 in the longer term.
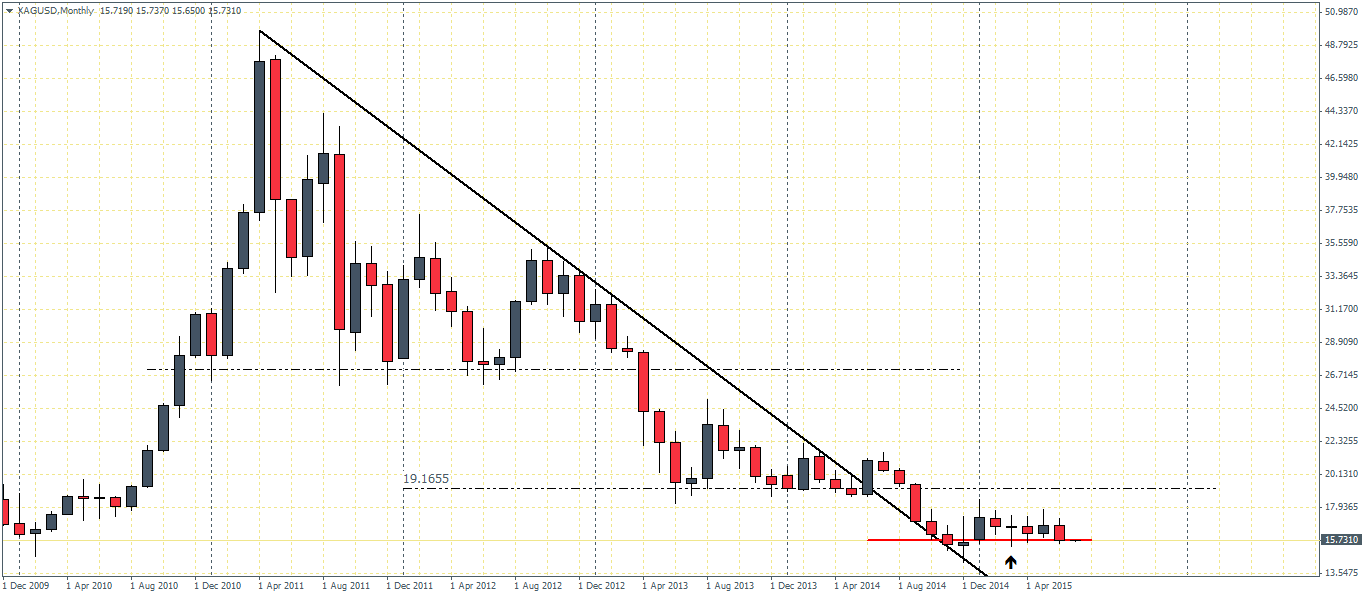
For Silver futures, the monthly charts shows price has been literally flat for the most part. The monthly charts also show the strong level of support formed near 15.6 region, which has managed to hold prices for close to six straight months. However, with June’s candlestick close on a bearish note, we could expect further downside to set in should 15.7 give way.
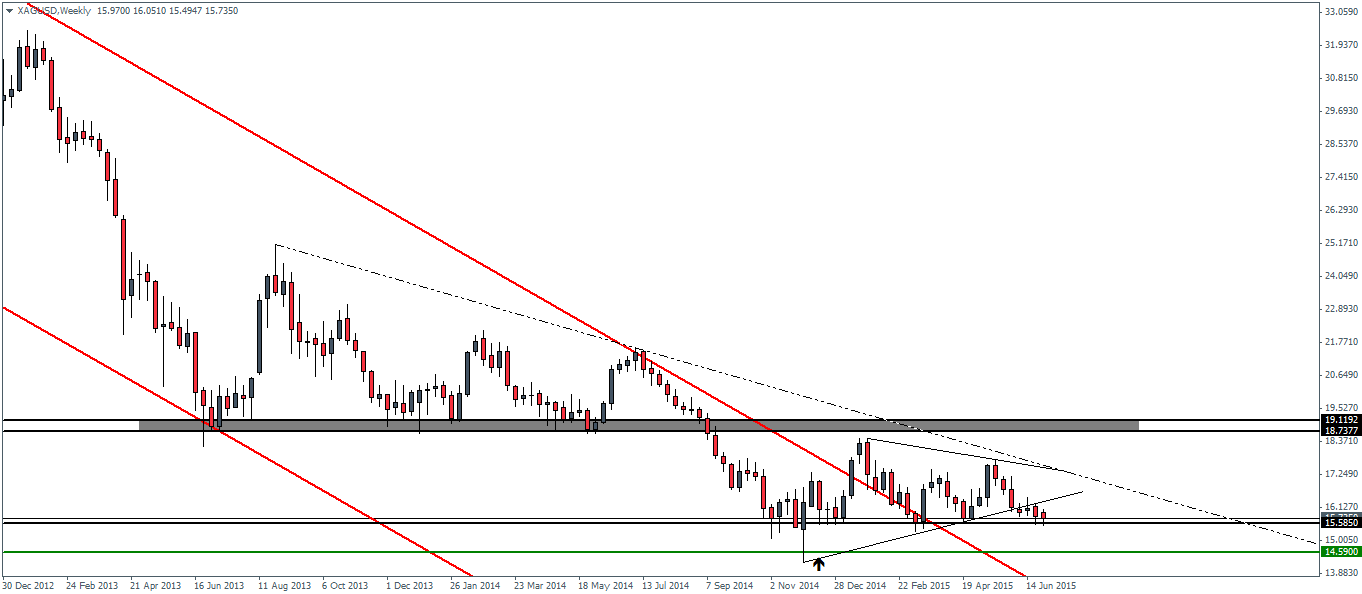
On the weekly charts, the bias to the downside is starting to be realized as the break of the symmetrical triangle is slowly taking shape. However, as noted in previous analysis, the support at 15.58 is proving to be a strong resistance to break and one which could keep prices trading sideways for a while. A confirmed break below 15.6 is needed in order for Silver to target the next support at 14.6.
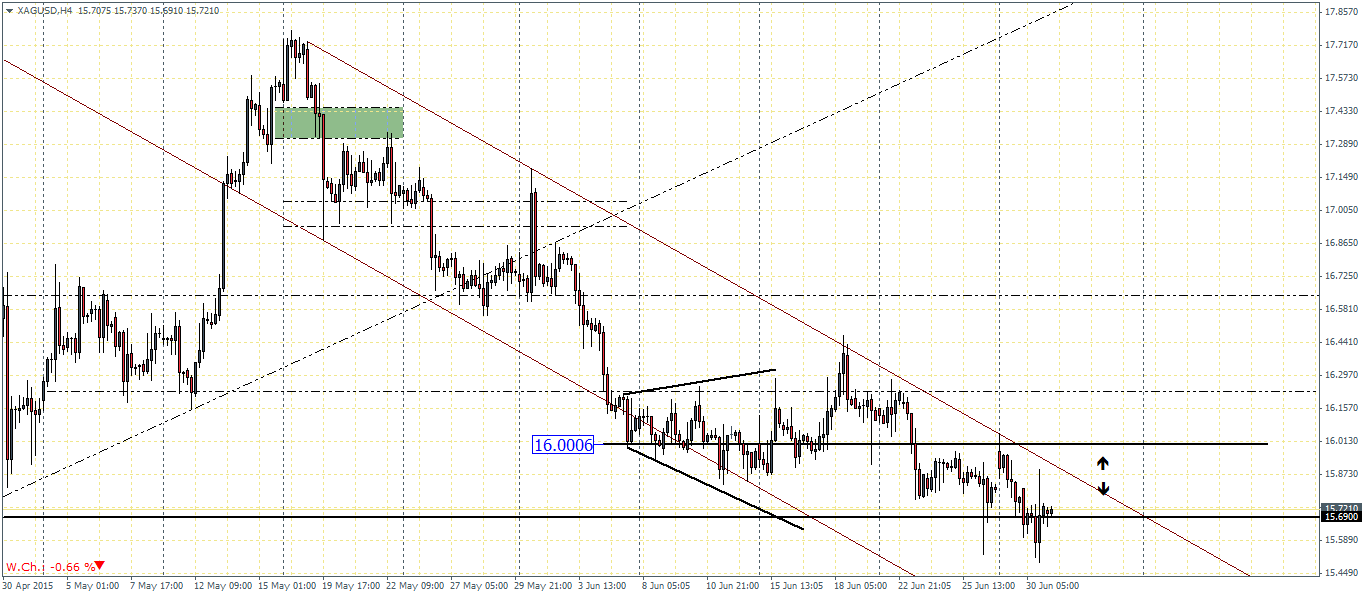
Last but not the least, on the H4 charts, as we pointed out last week about the importance of the price level at $16, we see this critical price point being broken and also briefly retested for resistance. Prices then fell lower and currently trading at support near 15.69. Currently, we could expect a bit of sideways price action between 16 and 15.69 but the downside bias could set in as soon as prices break below 15.7. Alternatively, watch for these two levels in relation to price and the price channel. A potential break out from the falling price channel and price seeking support near 15.7 or 16 could see a correction that could take Silver prices back to 16.7 region.