Crude Oil consolidates with more declines likely to follow through!
Crude Oil futures continued their decline, losing close to -1.9% for the week. The bearish momentum in Crude Oil was led by the news that Iran and the P5+1, led by the United States had reached a historic agreement on the nuclear issue. Despite missing deadlines, the talks were extended and it was earlier this week that the historic deal was announced, which would see the culmination of close to 20 months of negotiations. The international community is expected to lift most of the economic sanctions against the country as well as open up Iran’s Crude Oil exports to the rest of the world. The fact that Crude oil did not react much to the news this week shows that the event was already priced in.
The weekly US Crude oil inventory report from the US Energy Information Administration showed that stockpiles fell by 4.3 million barrels for the week ending July 10th, bringing the total number of stockpiles to 461.4 million, still one of the highest levels seen.
Crude Oil Technical Analysis
Crude Oil futures fell to a 12 week low, as prices briefly touched and pulled back near the $50.90 handle.

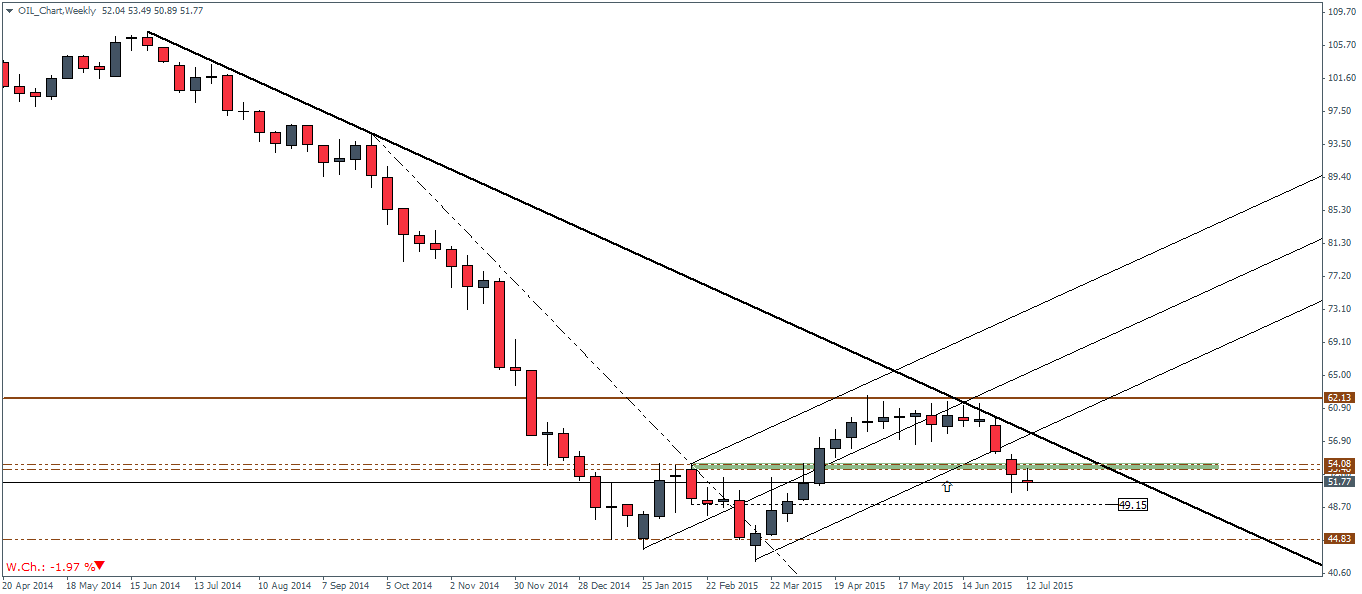
We had noted in our previous weekly analysis for Crude Oil that the sideways consolidation seen previously would send the price of Crude oil lower. On the weekly chart below we notice that prices broke down from the lower median line and are currently trading near the major support region at/near 54. To the downside, a minor support at $49.15 is the only hope to support prices, failing which, Crude Oil could easily test the previous lows near $44.83, last seen in late February this year. The rejection near the long term trend line further adds to the bearish bias as we expect Crude Oil to most likely trend lower in the near term.
This week’s price action saw Crude oil prices dip towards 50.58. The weekly chart for Crude Oil shown below gives the major support level near 54 – 53.3 region. A close below this support could decline further to test lower support at 48.87. However, in the event that prices close in the support zone, Crude oil futures could continue their rally this time potentially breaking above 62.13
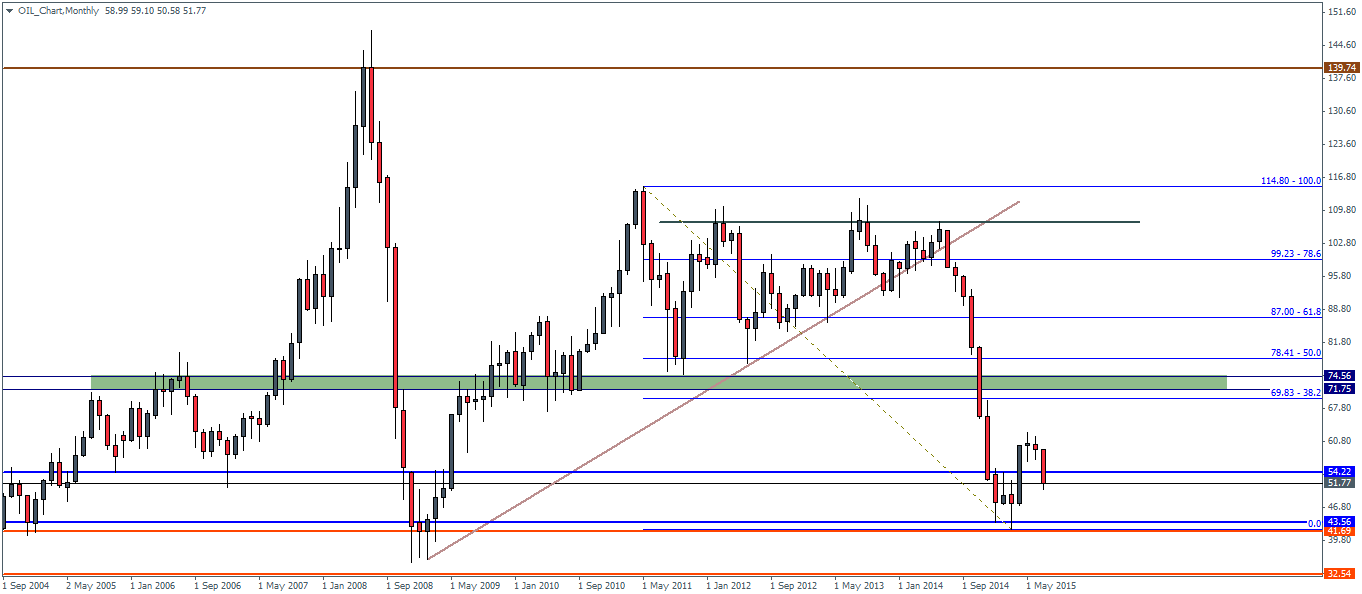
On the monthly time scale, Crude Oil futures is looking well poised for a test back to $43.56 going by the current price action, which is very bearish that comes after two sessions of consolidation near the highs of $60. It is possible that Crude Oil could very well test the lows to $43.56 – $41.7, the support lows which previously saw a strong rejection of prices.
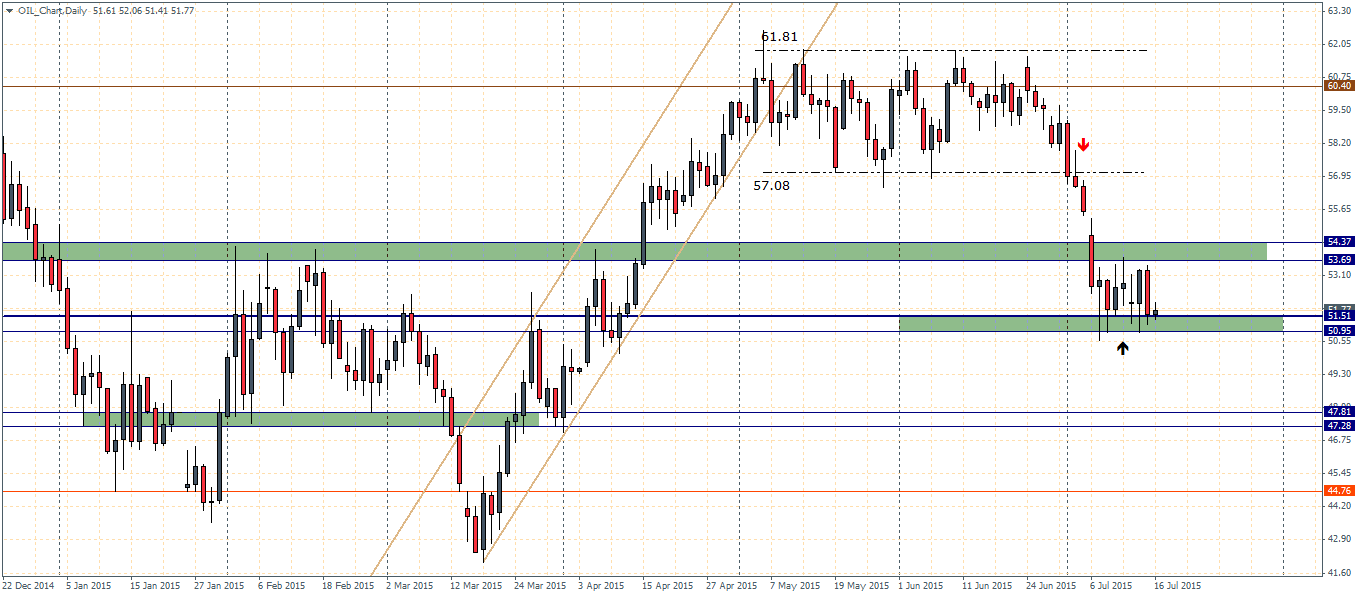
On the daily charts, Crude Oil is trading near a support level between $51.51 – $50.95, while to the upside, resistance near $54.37 – $53.7 is likely to hold any rallies in Crude Oil. We expect some kind of consolidation to take place in this zone ahead of a further break out to the downside, while also watching for a potential bearish flag or a bearish consolidating taking place. The next support levels come in at $47.81 – $47.28.
A close above $54.37 is required to shift the bias back to the upside, however it seems unlikely at this point.