Crude oil prices decline on expectations of progress in Iran nuclear talks
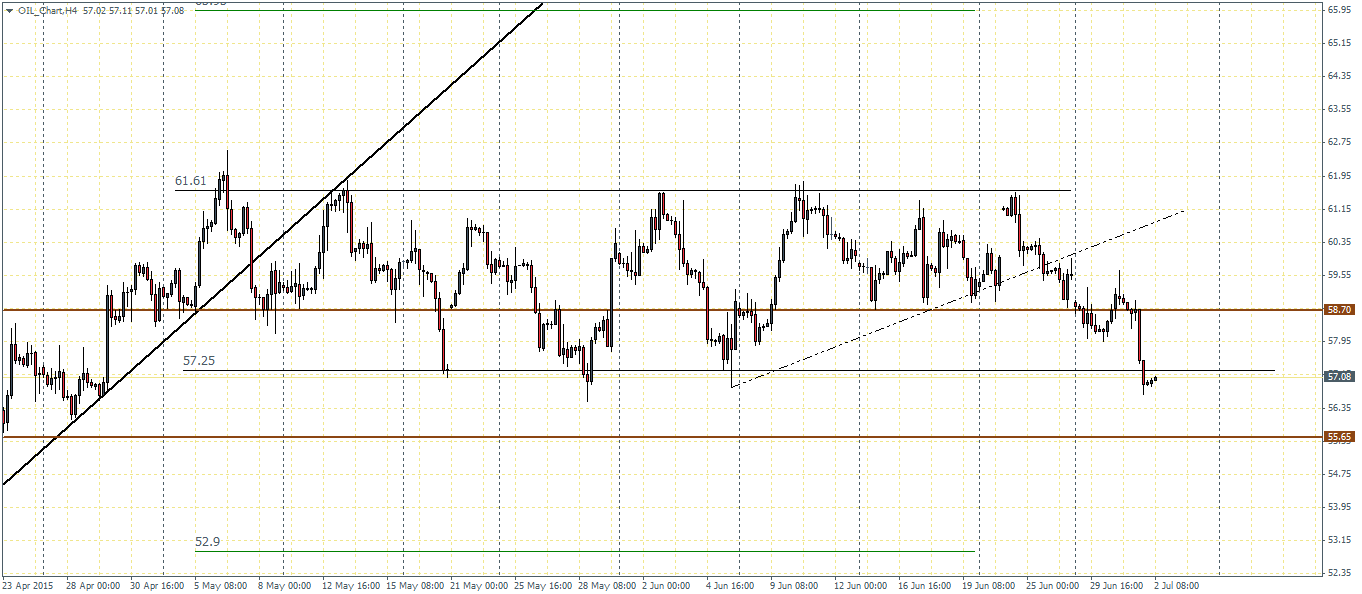
Crude Oil futures are currently looking south after trading sideways for close to two months since May, stuck within the highs of 61.81 and lows of 57.08. The main catalyst for the decline in Crude Oil prices was the Iran nuclear deal negotiations that initially had a deadline of June 30th. The deadline was later extended as talks seemed to progress. It is expected that the foreign ministers involved in the negotiations will review an initial draft with expectations for some resolution to be reached by today or tomorrow.
The decline in Crude oil prices is on account of a deal being reached with Iran, which would lift the West imposed sanctions on the country. In such an event, Iran would be able to free export its Crude Oil and the onset of fresh supply in an already overwhelmed market could potentially push crude oil prices lower.
Earlier this week, the US EIA released its weekly Crude oil inventories, which showed US Crude oil stockpiles rising 2.4 million barrels for the week. The rise in inventories marks the first increase of Crude oil stockpiles since April.

Crude Oil Technical Analysis
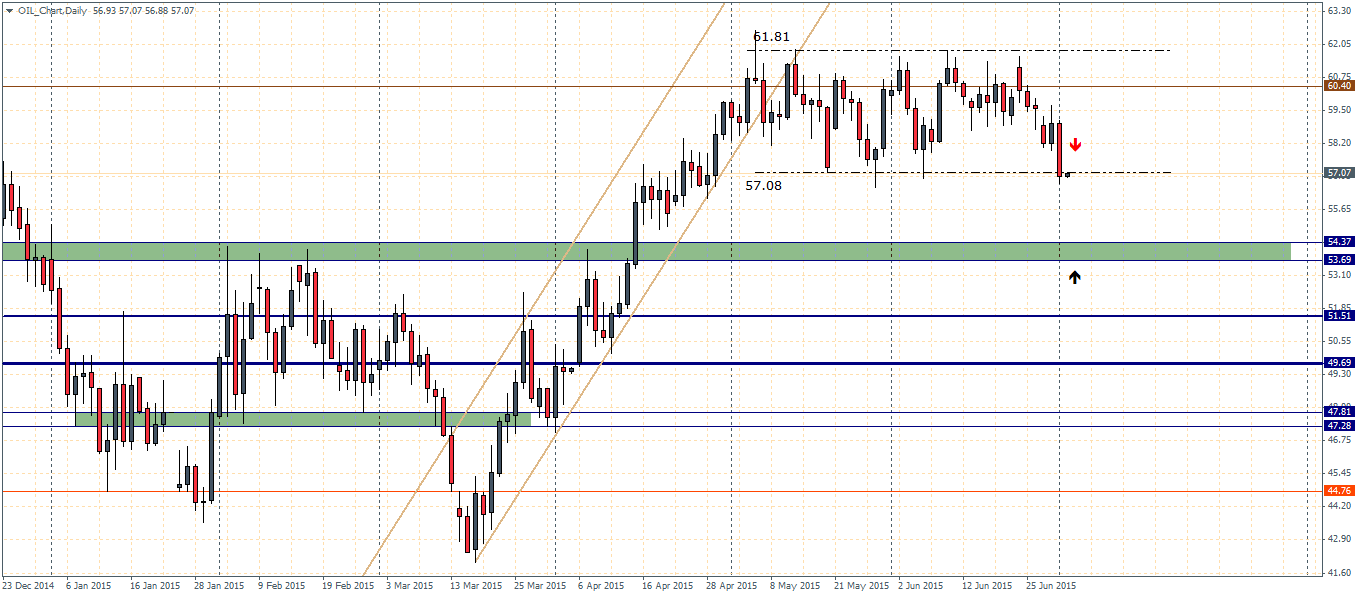
The current break down in Crude oil prices is however not yet convincing as prices still hug the lower support at 57.08. A further bearish confirmation and preferably a retest back to 57.08 as a test of resistance is needed to confirm the decline. In such an event, the next support comes in at 54.37 – 53.7
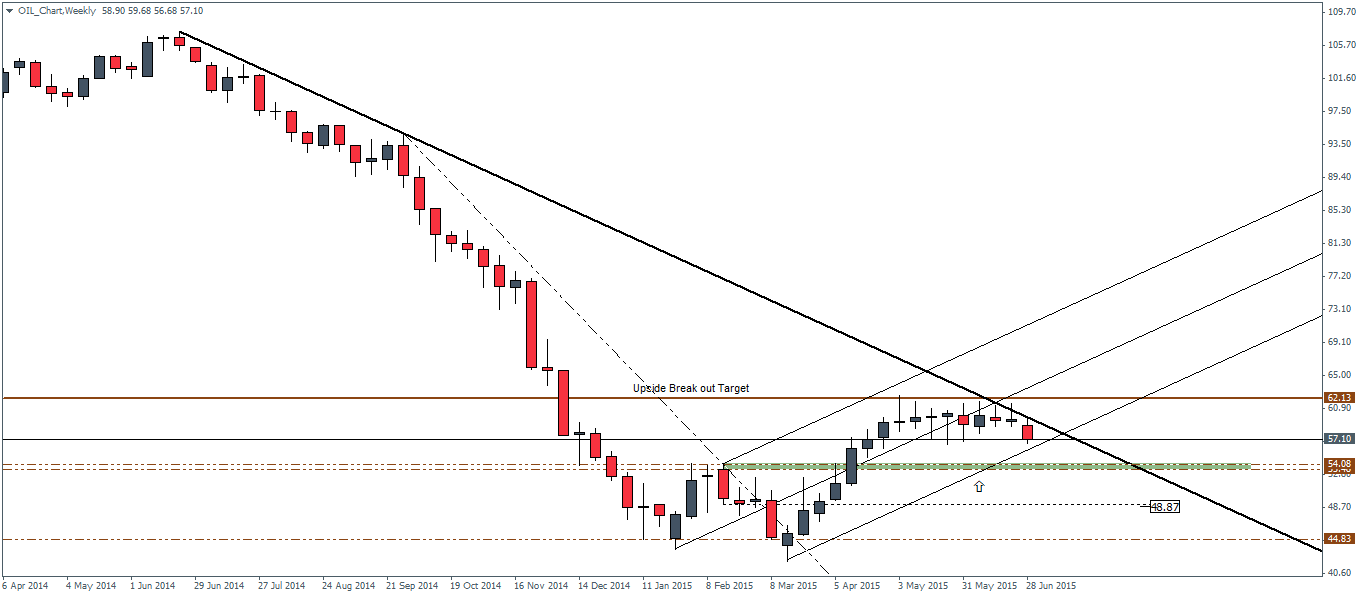
On the weekly charts, the sideways price action seen for close to 8 weeks just below the main resistance at 62.13 is indicative that the correction to the upside in Crude oil is not yet complete. The current declines could see a dynamic support off the lower median line and in the event of a dip lower, the region of 54 is certain to hold prices. A bounce from $54 could potentially set the stage for a strong rally to the upside with a test to 62.13 resistance. The trend line plotted on the weekly charts is also one to watch for as a break of the falling trend line could indicate the onset of a possible larger correction in prices.
Finally, on the H4 charts, the range break out looks more evident with the break of minor support at 58.70 followed up by a break below 57.25. A possible retest to 57.25 would confirm the move and gives a minimum price objective to 55.65 as the next major support and eventually down to 52.9. The H4 measured move’s objective of 52.9 shows a strong confluence with the weekly chart’s analysis which points to the support near the region of 53. As such, this level could be important as it could most likely determine the next course of action in Crude Oil prices.