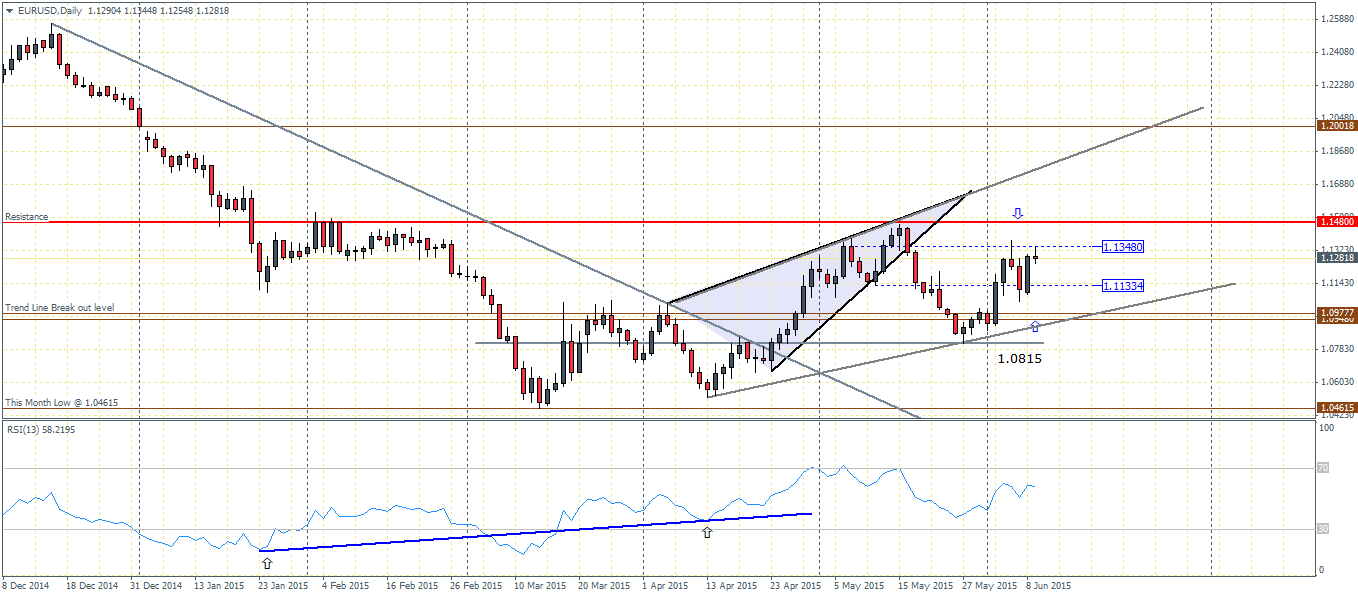
EURUSD (1.1287): After the quick drop from the rising wedge/triangle pattern, EURUSD found support near 1.0977 region and promptly saw a reversal from here around 27th May 2015. The bullish engulfing candlestick pattern from this support level gave the first indication that EURUSD had potentially formed a bottom near the 1.045 region and that new support was established at 1.097 – 1.10 level of support.
We now notice a broadening wedge pattern being formed. Looking forward, we need to see EURUSD rise above 1.148 and potentially establish support at this level in order to look for higher gains. The price zone of interest is 1.148 and 1.1348. Failure to break above 1.148 will likely indicate that prices could consolidate before providing further clues in EURUSD’s directionality. Yesterday’s candlestick formed a strong bullish engulfing pattern and we expect to see this bullish pattern being followed through either today or tomorrow. A close below yesterday’s low at 1.108 will indicate the possibility of some sideways price action on the horizon.
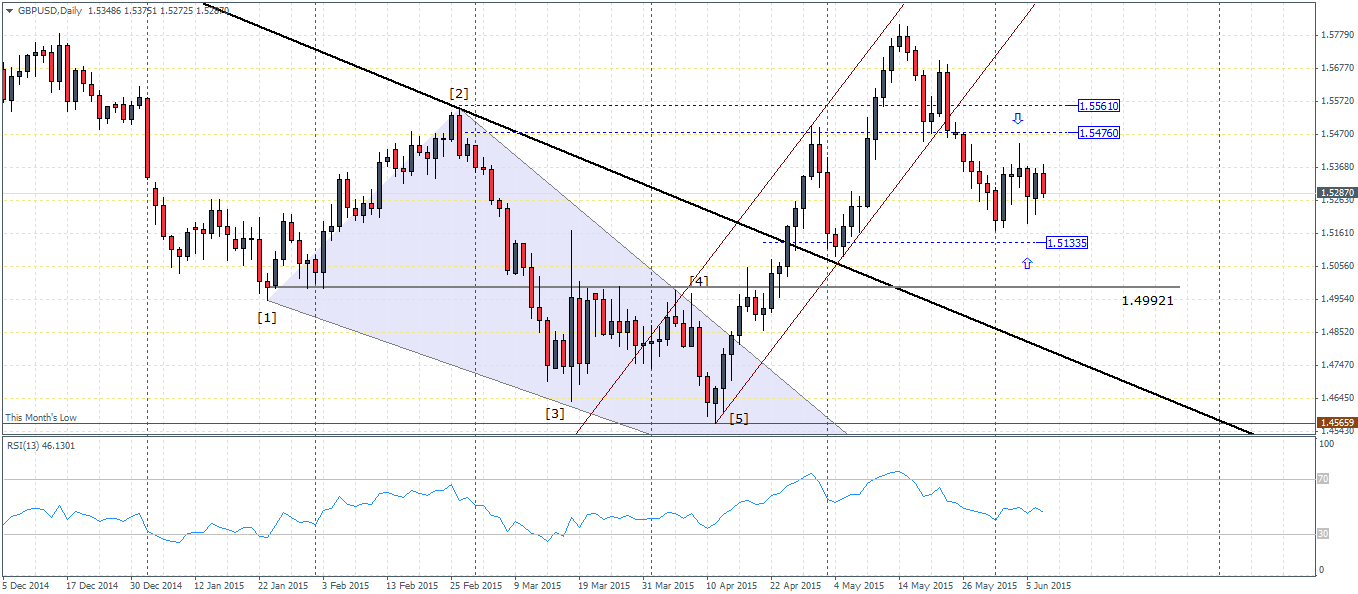
GBPUSD(1.5292): The Cable has been trading sideways and within the range of 1.5368 and 1.5161 price levels for the past seven sessions on the daily charts. We could therefore anticipate a possible break out in the near term. To the upside, a break out above 1.5368 will see a rally towards 1.5561 – 1.5476 level of resistance which looks to be quite strong. To the downside, a break out below 1.516 will see a dip towards 1.51335 and possibly lower to 1.4992 or 1.50 (rounded off) level of support.

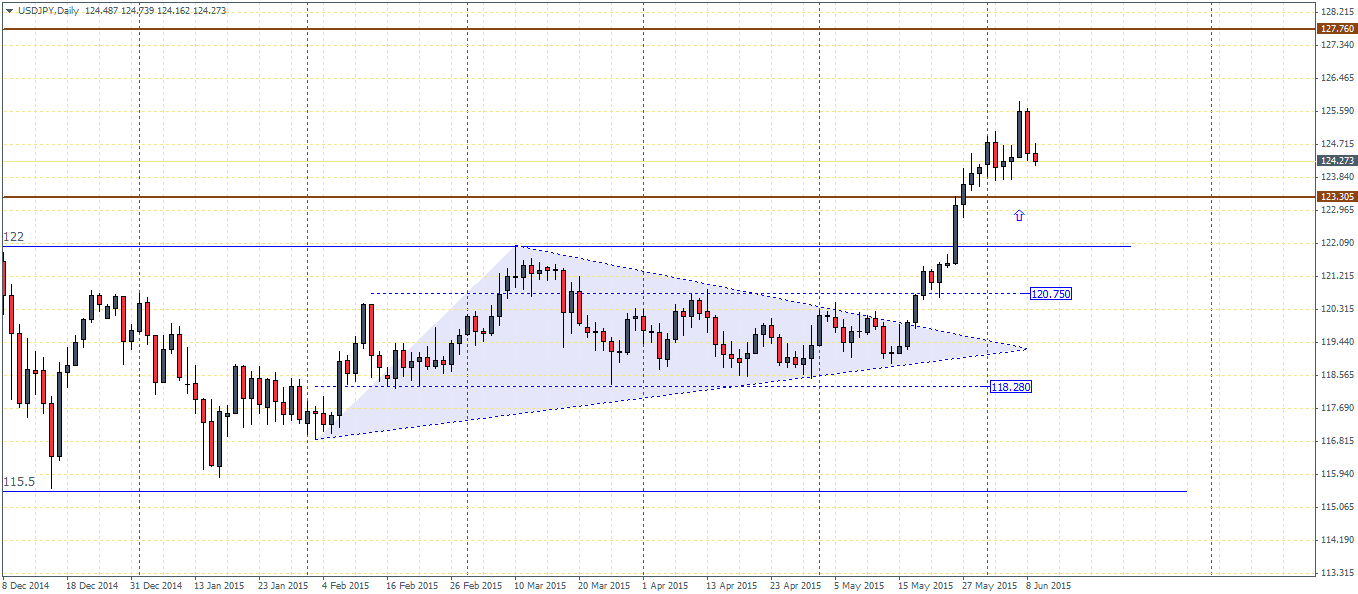
USDJPY(124.22): USDJPY still has quite some room to the upside with the measured move target to 127.76 still a possibility. The breakout above 123.305 and relative to the current price action shows a likely decline here to test for support which should help the Dollar to push higher against the Yen. Below 123.305, next support comes in at 122, both of which look to be a strong level of supports. Therefore, USDJPY is still biased to the upside and a dip lower could likely see new buyers come into the markets which should help push USDJPY towards its eventual target to 127.76.
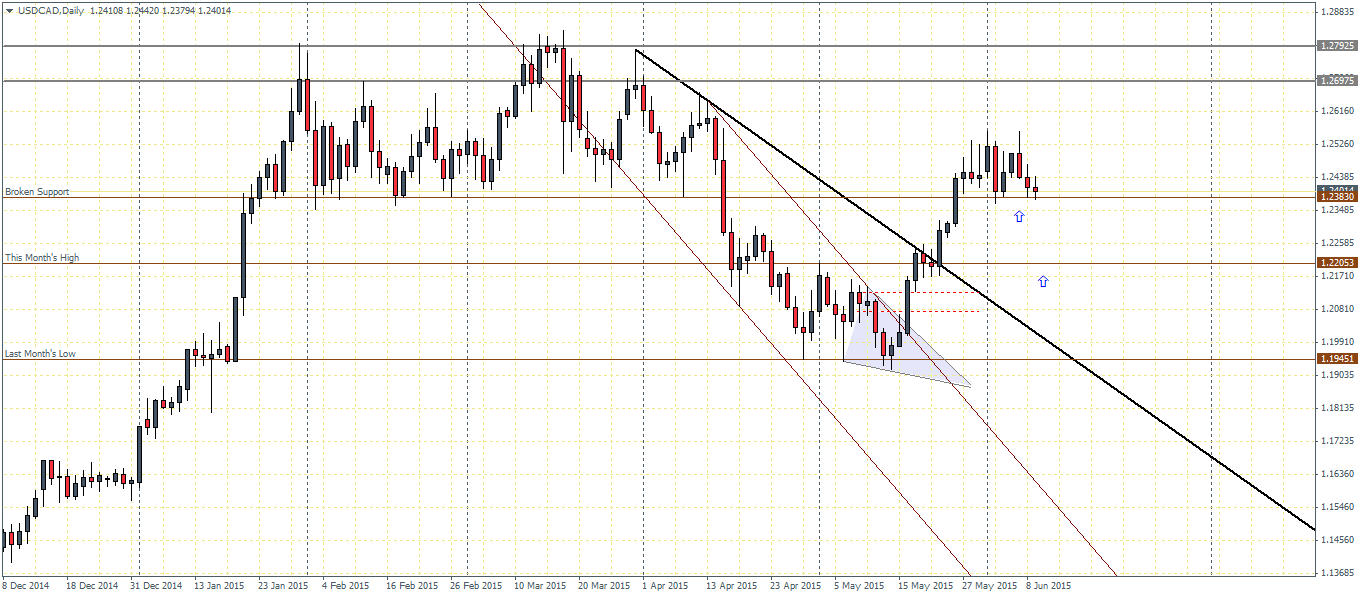
USDCAD(1.239): The price level of 1.2526 looks to be a strong resistance zone that has managed to hold prices lower. The decline towards 1.2383 is now an important level to watch for. A break below 1.2383 will see USDCAD likely to test the next support at 1.2205 region, which would also form a retest/confirmation of the break out from the falling trend line. In the event 1.2383 does manage to support prices, USDCAD could potentially break out above 1.2526 and could eventually target 1.2697 – 1.279 level of resistance which also marks a previous all time high in the USDCAD.
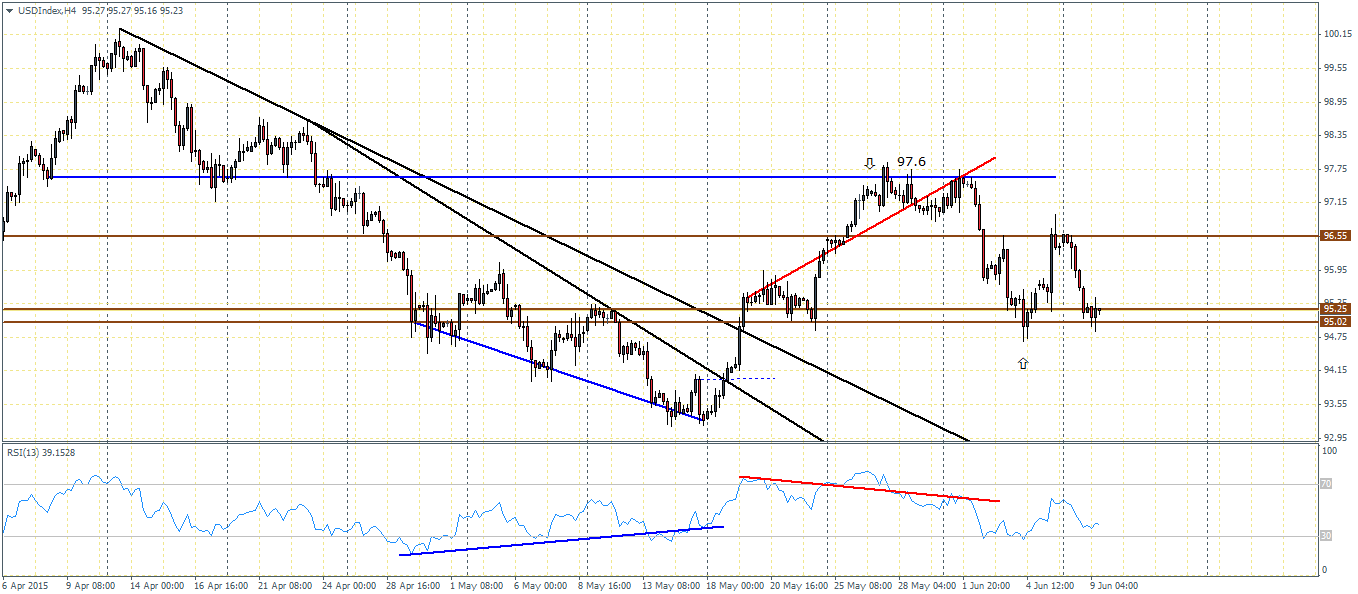
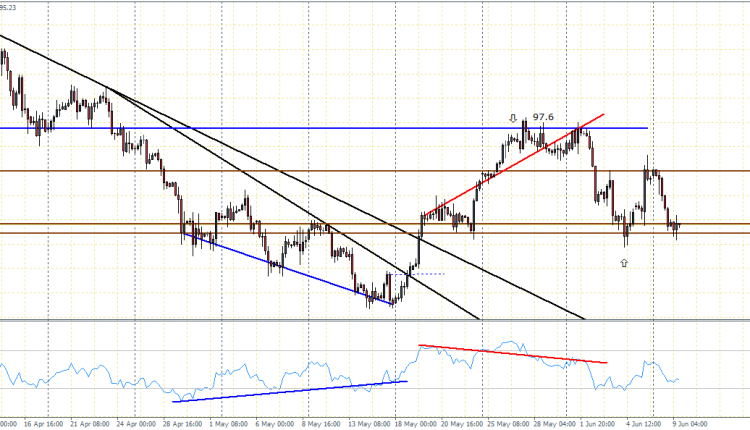
US Dollar Index (95.22): Following up from previous week’s analysis, the Dollar Index found resistance at 96.55 and promptly decline lower and currently testing the support between 96.25 – 95. Price action is also shaping out to be a potential double bottom at this support. If this double bottom holds near the support, the US Dollar index could possibly test previous highs at 97.6 and above. However, should support give way here, the US Dollar Index will decline towards 93.55 – 94.15 level of support. On the daily charts, yesterday’s candlestick formed a bearish engulfing pattern and it is likely that the support at 96.25 – 95 will give way.