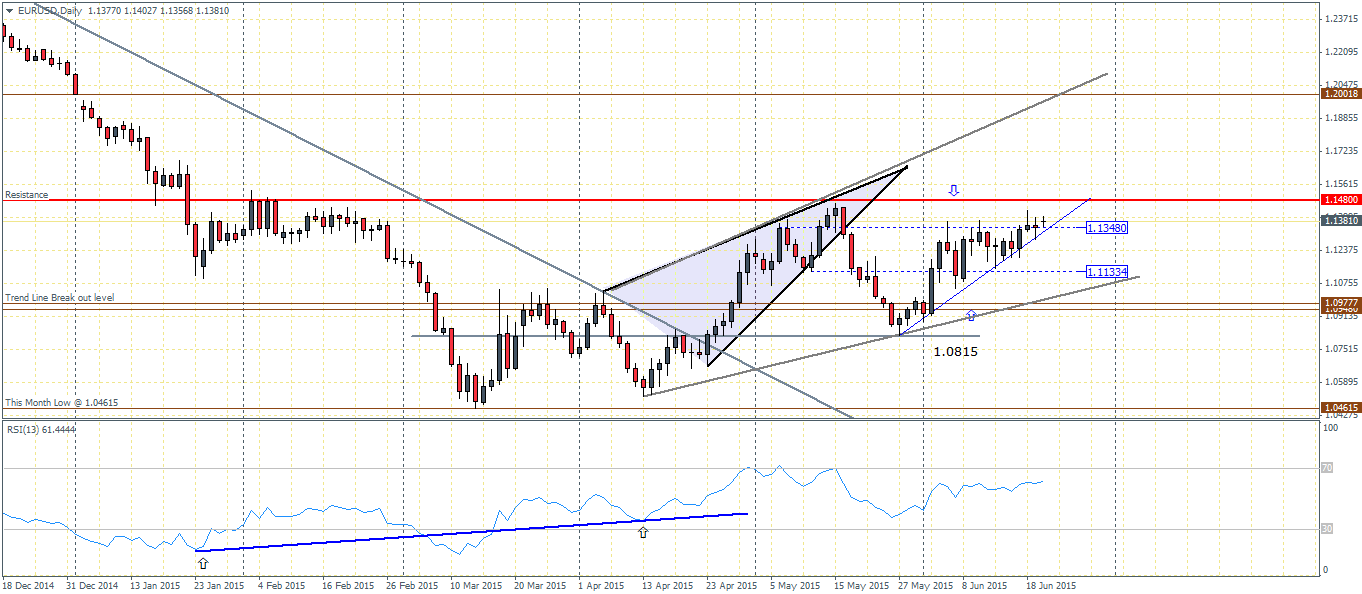
EURUSD (1.137): EURUSD managed to close above 1.1348 but the daily candlesticks look weaker at this level. Plotting the minor trend line, it looks likely that a break of this trend line could see the EURUSD dip back to 1.1133. We could therefore expect to see some consolidation within 1.1348 and 1.1133 levels. To the upside, a close above 1.148 is required for the bullish momentum to step in, while to the downside, a break of 1.10977 will see a decline to 1.0815 and eventually 1.04615, depending on how price action forms near these levels.
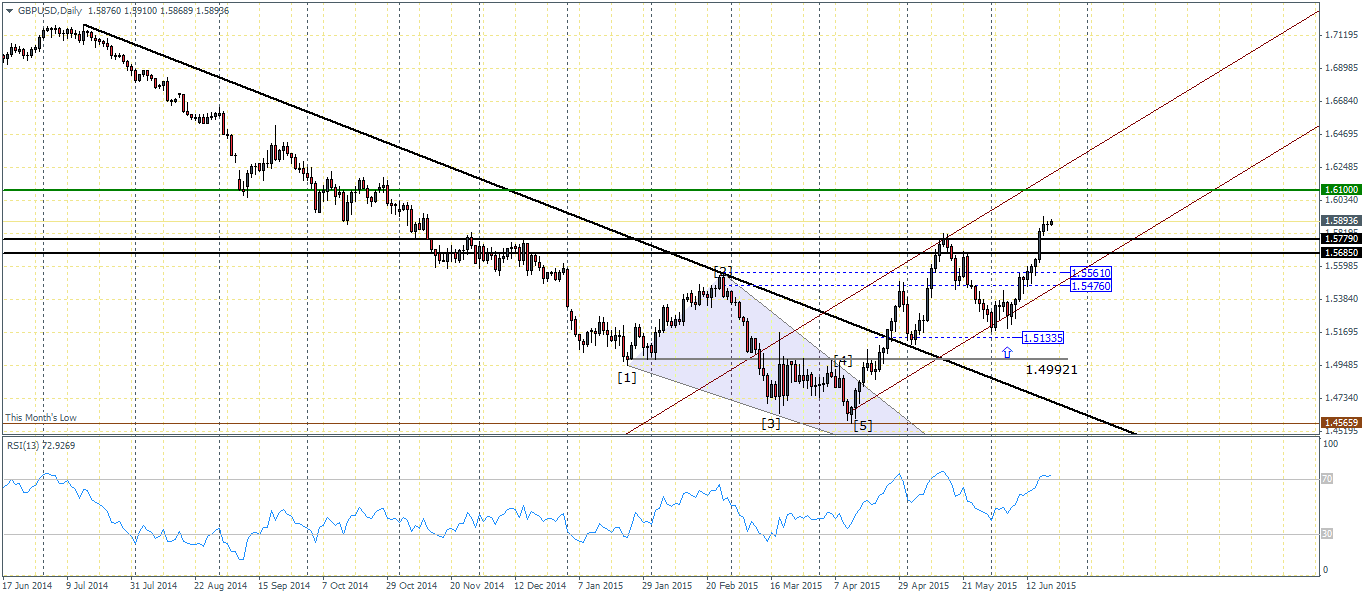
GBPUSD (1.589): GBPUSD has cleared the resistance at 1.5779 and 1.5685. We could expect a dip to this broken resistance for support. The next resistance comes in at 1.61 level. With price trading within the rising price channel, a decline to 1.5779 – 1.5685 could see further gains in store with renewed bullish momentum pushing the Cable higher.

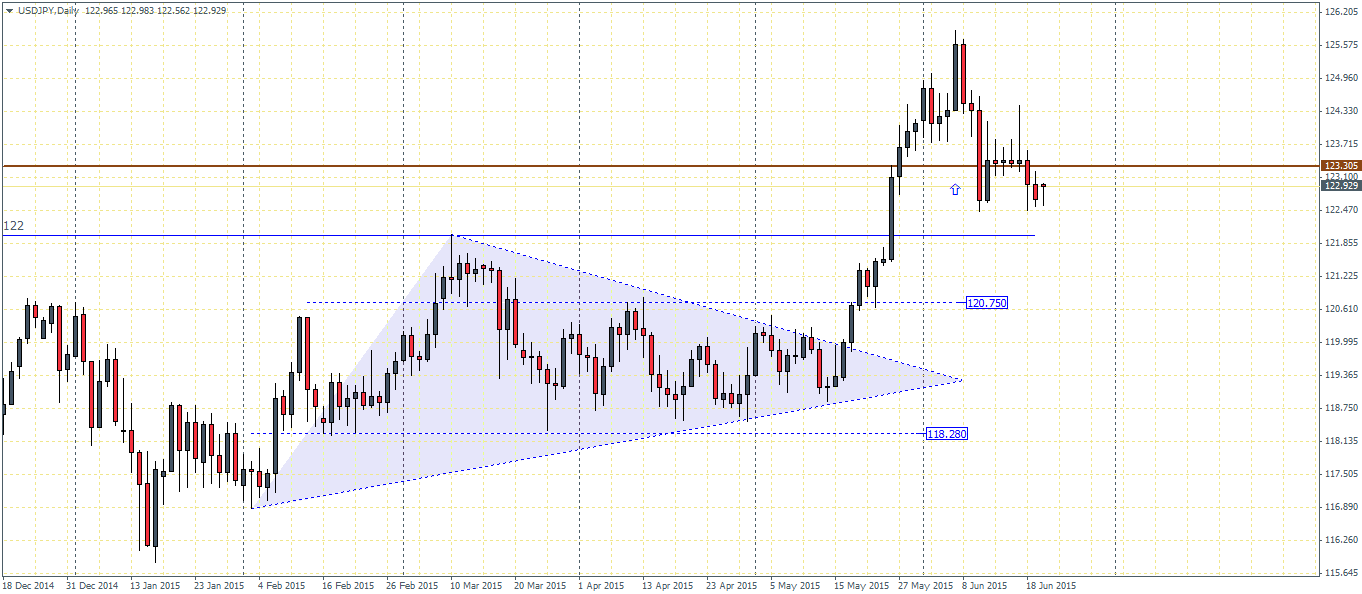
USDJPY (123): USDJPY has been consolidating near 123.3 level of support/resistance. While briefly declining lower from this level, price action could see a further decline to test the broken resistance for support at 122. A successful test of support here could see another attempt to break above 123.3, following which the eventual target to 127 is likely. To the downside, a close below 122 could see a dip to 120.75.
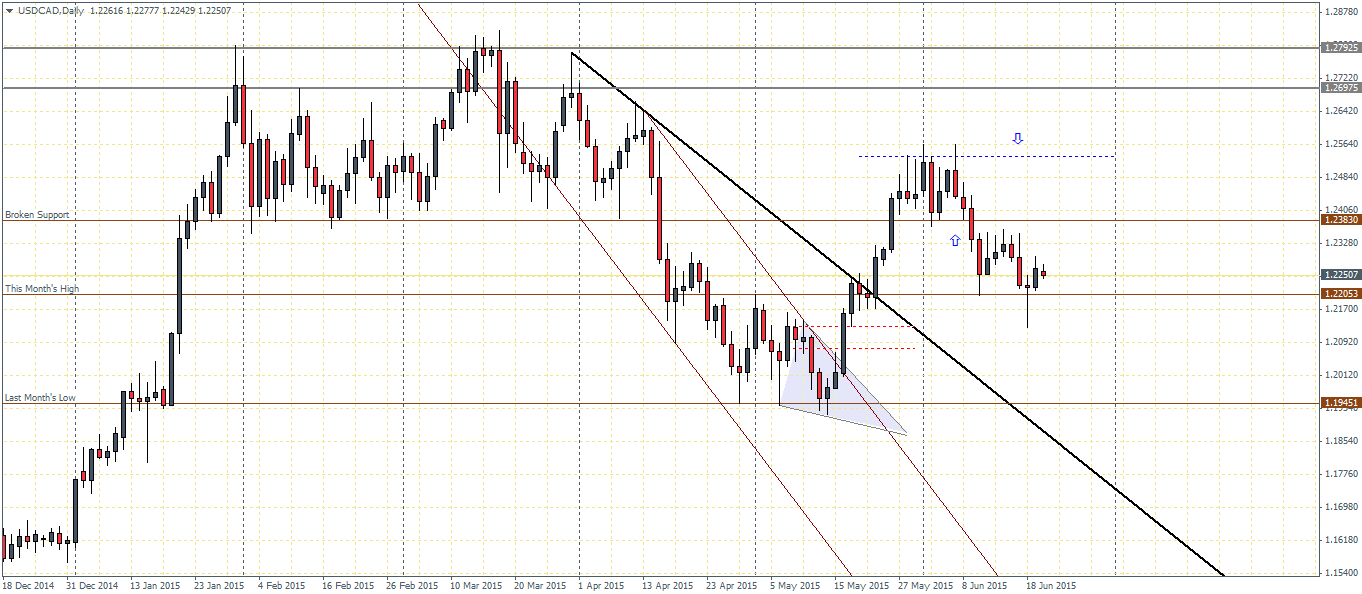
USDCAD (1.225): USDCAD tested the trend line break out level at 1.22 more decisively and reversed from this level with a doji rejection candlestick pattern. This is indicating a possible move to the upside followed up by a bullish candlestick pattern. USDCAD could see a rally towards the next resistance at 1.2383 level.
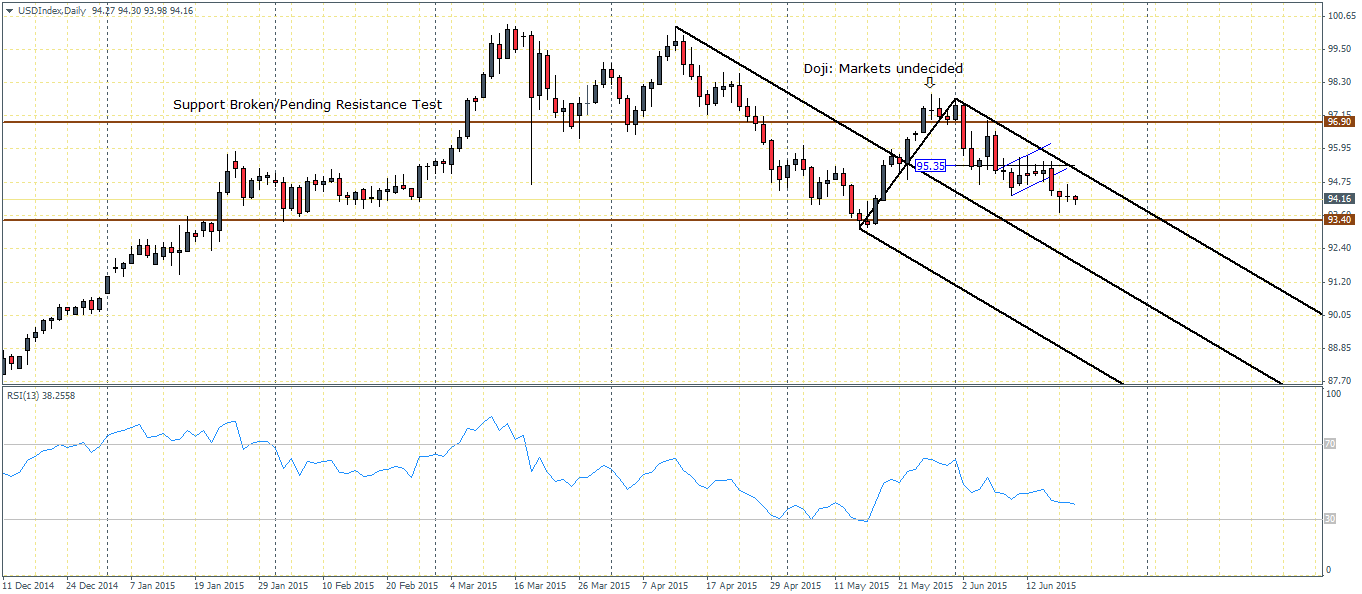
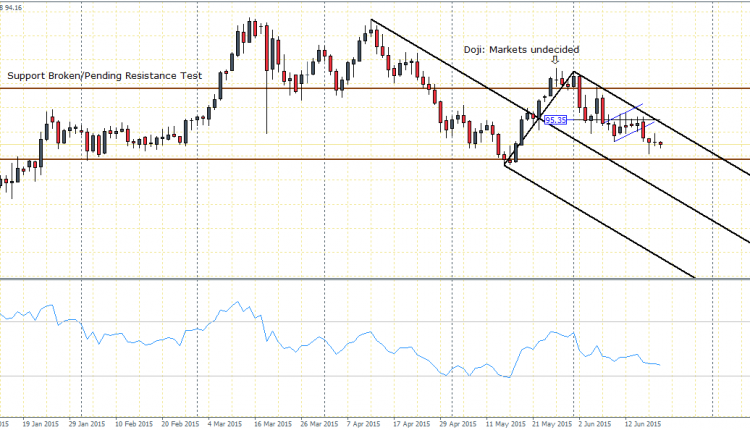
USDIndex (94.13): US Dollar Index: The US Dollar index broke out from the minor bearish flag pattern within the median line. The measured move of the flag pattern shows a conservative target to 92.66, just below the 93.4 level of support/resistance. We expect that the US Dollar could likely decline to the support near 92.66 before we can expect to see a corrective rally take shape. Friday’s price action closed with a doji candlestick pattern and if today’s daily candlestick closes on a bearish note, we could expect further declines in store.