EURUSD (1.122): EURUSD has moved into a range/sideways price action trading within the levels of 1.1348 and 1.1133. To the downside, support is at 1.097 and we expect a possible dip to this level in the coming days, unless prices manage to break above 1.1348, which will see a struggle to break above 1.148. In terms of the daily candlestick patterns, we notice a doji candlestick formed on Friday, which comes after a fair rally from the lows near 1.082. The doji candlestick is indicative of a possible correction to this rally. A break below 1.097 will see EURUSD potentially decline to the previous lows at 1.046.
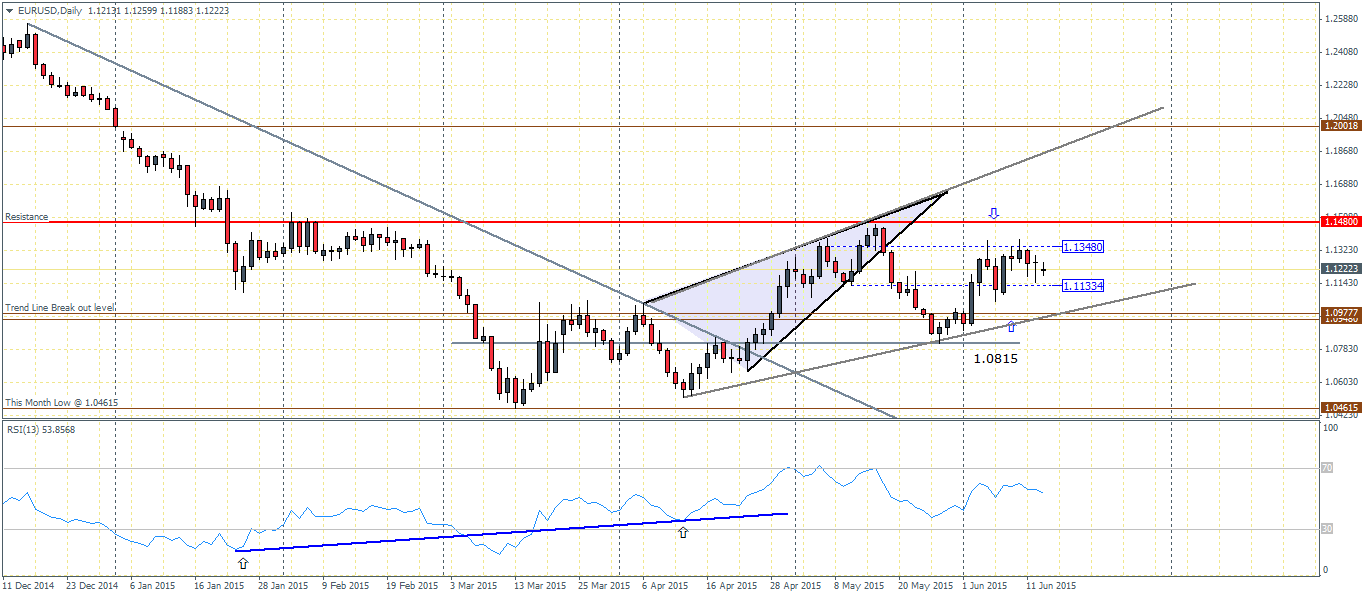
However, taking into consideration the larger scheme of things, we remain optimistic that the EURUSD could decline initially towards 1.09 – 1.08 levels before the single currency posts a fresh leg of rally.
GBPUSD (1.55): The Cable has been fairly strong against the Greenback after the Pound Sterling declined towards 1.52 level of support. Price action is back to the broken support at 1.556 – 1.5476 which is being tested for resistance. As long as 1.5561 holds as resistance, GBPUSD could see a new decline towards the lower technical support at 1.51335 but could likely struggle near 1.5368 which marks a short term support level.

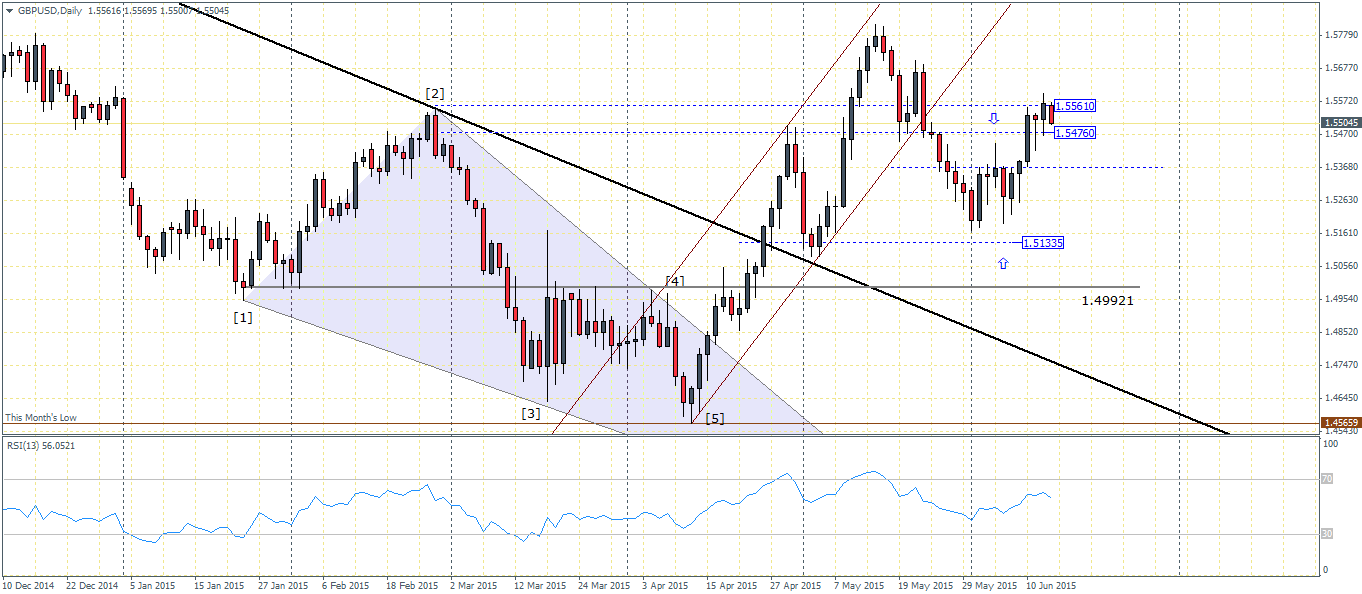
In the larger scope, GBPUSD is well positioned for a continuation to the upside and a test to 1.5368 will be critical in this aspect.
USDJPY (123.5): After sharp declines last week, USDJPY is seen consolidating near 123.305 level of support. We expect to see a rally to the upside to take shape should prices manage to establish support at this level.
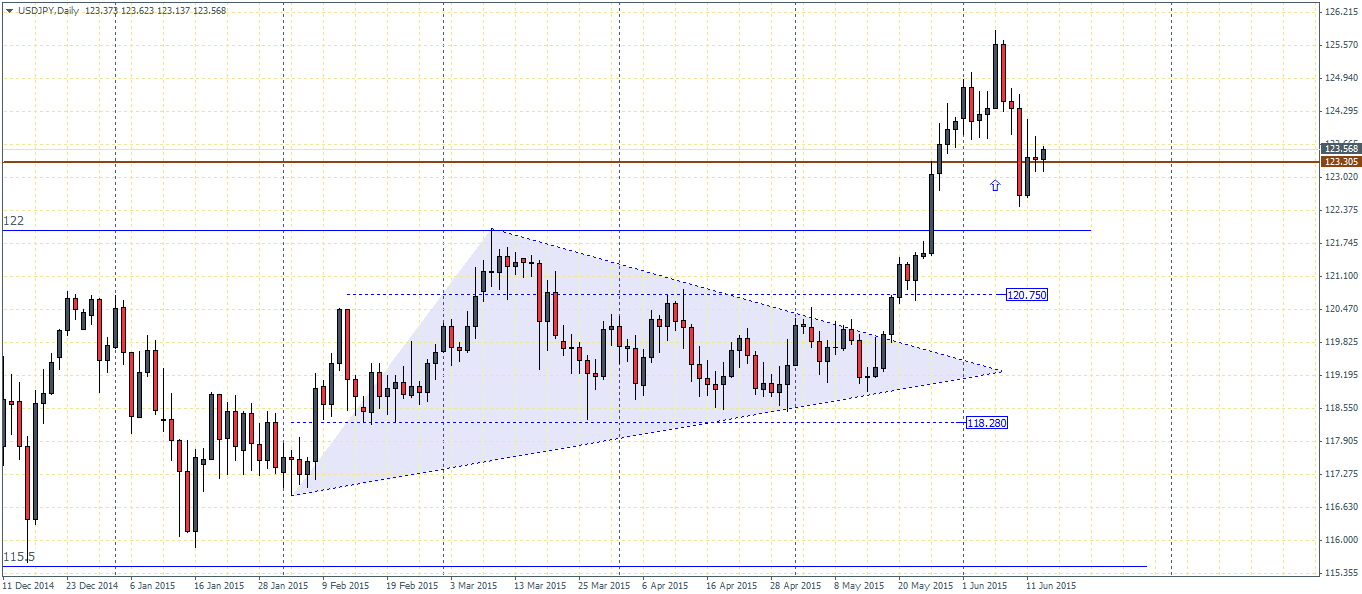
The rally is likely to target the region of 127.76 on break above the previous highs at 125.665. On the other hand, failure to find support at 123.305 will see USDJPY decline lower to the next support at 122
USDCAD (1.234): The USDCAD currency initially attempted a rally on break out of the trend line but failed to hold its gains and declined from 1.2539 level of resistance.
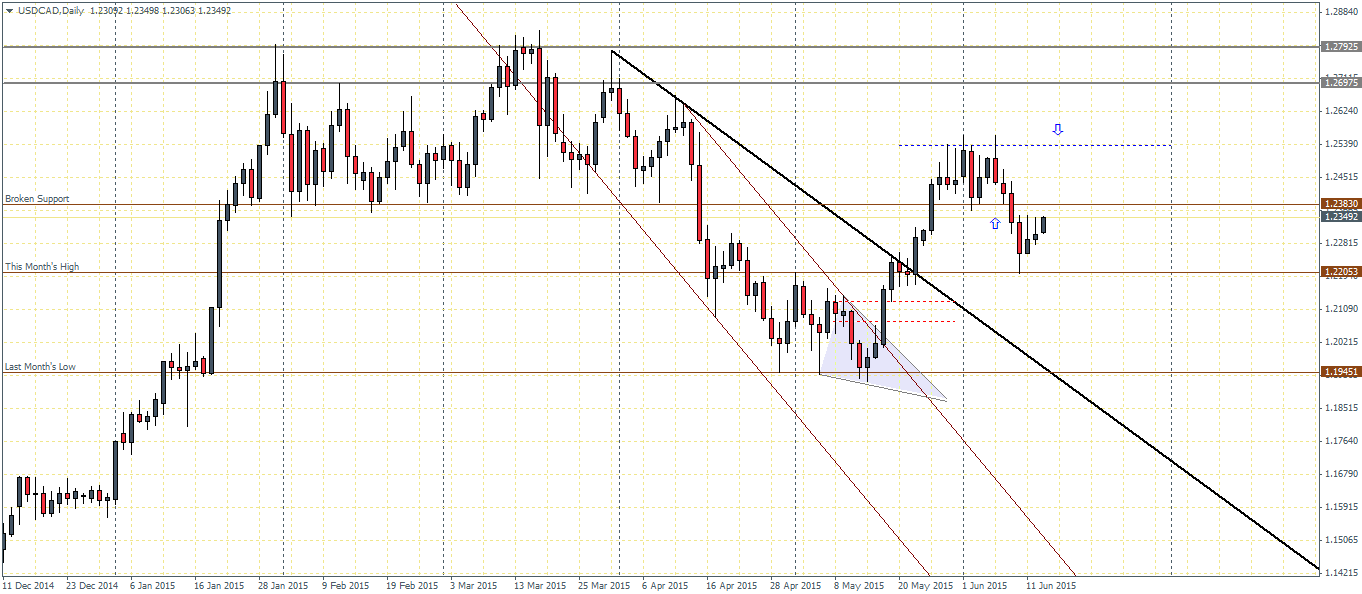
Prices broke through 1.2383 support and briefly tested the break out level near 1.2205. The current rally in USDCAD could potentially hit a roadblock near the resistance of 1.2383. A close above 1.2383 is needed for the USDCAD to aim for previous highs at 1.2539. On the other hand, if resistance is formed at 1.2383, USDCAD could well decline and test the trend line break out level at 1.2205.
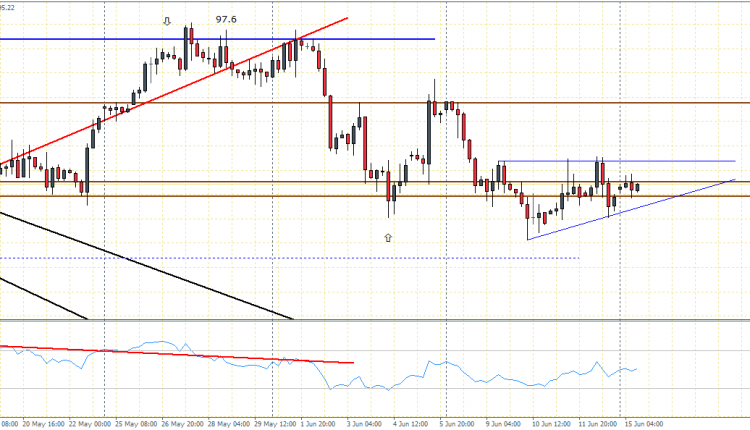
US Dollar Index (95.22): The US Dollar Index has been consolidating near 95.25 and 95 level of support. The daily chart timeframe has been consistently posting higher lows for the past three sessions indicating a possible move to the upside. Price will however need to clear the support at 95.25 which could see the Index rally towards the next resistance at 96.55.
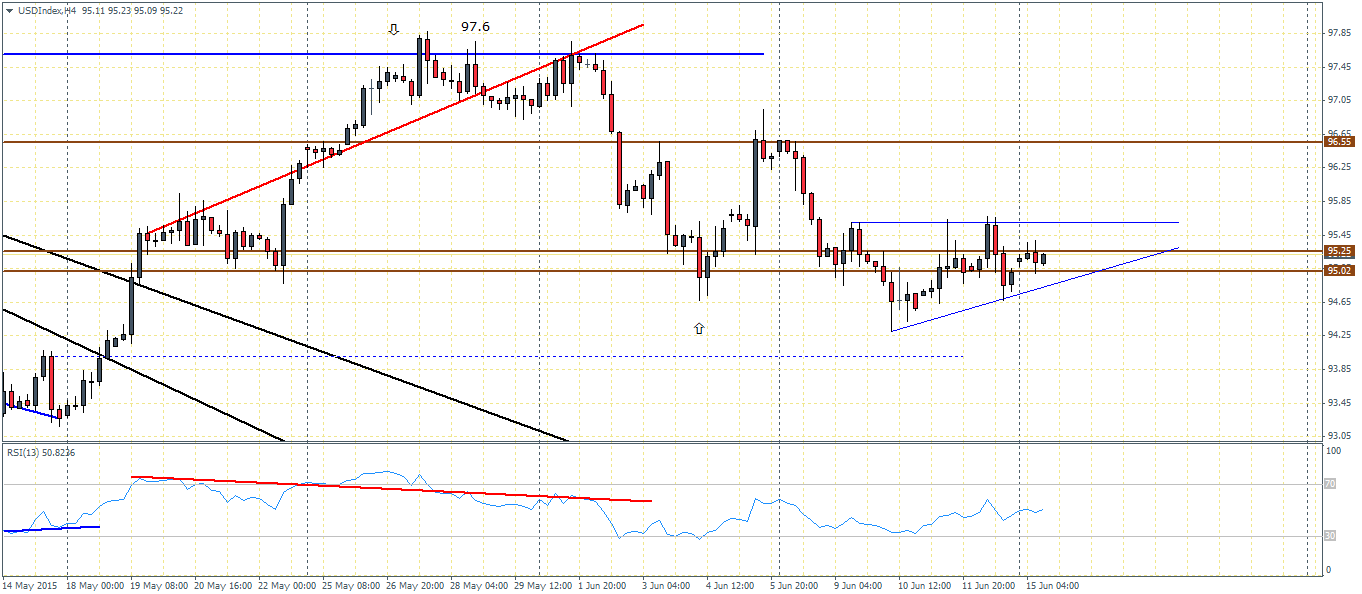
To the downside, a break below 95, which has already seen a few fake moves could be set into motion that could see the US Dollar index decline to the next technical support at 94.
We are the view that the US Dollar Index has the potential to rally considering the ascending triangle pattern that has formed. This pattern, incidentally also gives an upside target towards 96.55.

![Credit Card 160×600 [EN]](https://assets.iorbex.com/blog/wp-content/uploads/2023/06/13144507/Blog-Banner_EN-Banner_160X600X2.webp)