
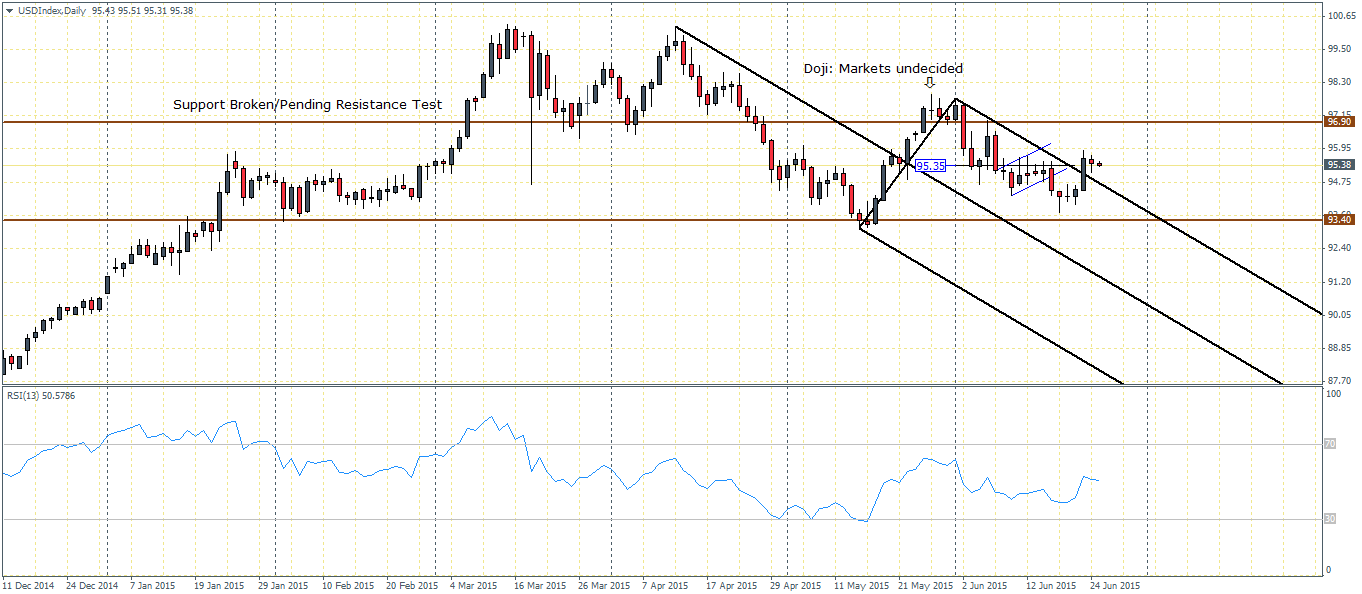
The US Dollar Index is looking to close the week on a bullish note after three straight weeks of decline, reversing from the weekly lows of 93.70 to trade currently near 95.5.
On the daily charts, the current price action has invalidated the bearish flag as price action managed to close above 95.35 price level. We also notice that price managed to break out from the upper median line which shifts the bias in the US Dollar Index to bullish. The next resistance level to the upside is at 96.90. We do expect the US Dollar Index to potentially turn sideways trading within 96.9 resistance and 93.4 support. The rally to 96.9 would see a potential test of resistance, which was previously a support level. If prices are capped here, near 96.9, we could expect to see further downside momentum set in at the very least towards 93.4 support.
On the H4 chart timeframe, the previous declines stalled near the 94 which was the break out level from the falling wedge pattern. The strong reversal from here saw a rally in the prices with the current consolidation taking shape of a bull flag. Considering that the bull flag is forming above the support level at 95, we could expect prices to hold above 95 and could see a break out to the upside. With 96.55 coming in as the initial resistance level that price action could struggle to break, the bull flag gives a potential measured move to as high as 97. There is however a small risk that prices could fail the bull flag and drop below the support at 95, towards the break out from the falling price channel near 94.5.

However, should prices test the 96.55 level of resistance into support, we could possibly see further upside gains in store for the Greenback.
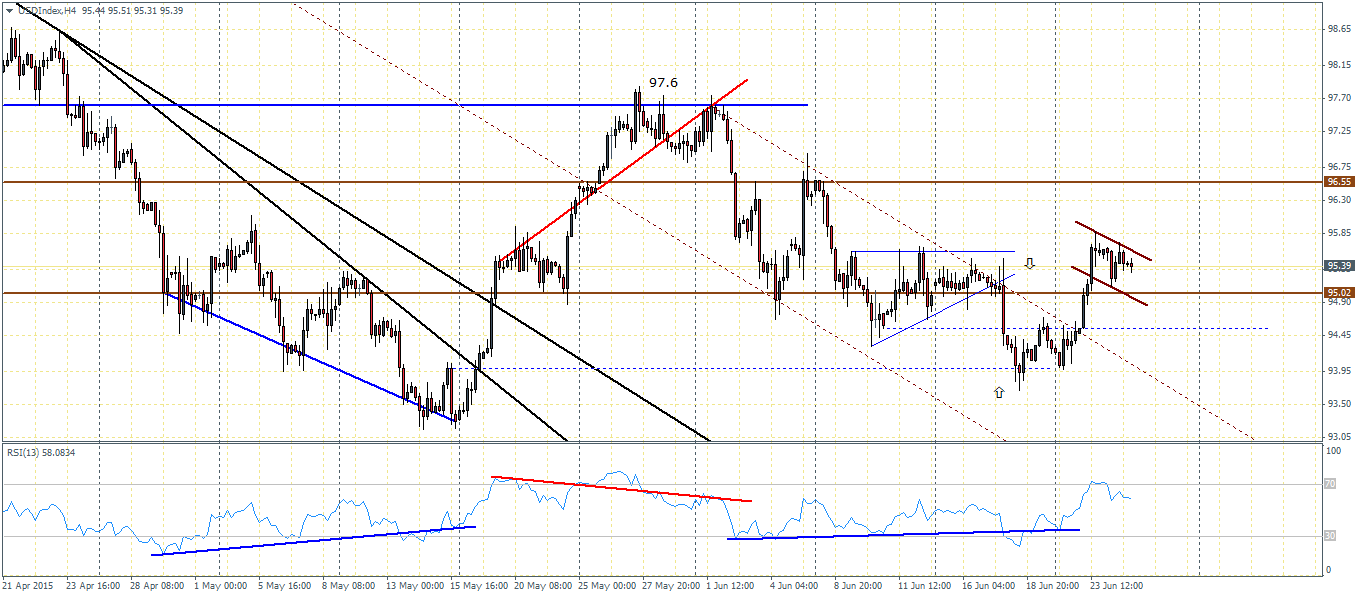
The current rally in prices is also supported by the divergence to the RSI, where we notice the oscillator making higher lows against price’s lower lows. The price level of 95.85 will be important to watch as a close above this level could set the stage for a bullish rally resuming in the Greenback.
From a fundamental perspective, the ongoing Greece crisis has failed to find any clear resolution as the deadline for the June 30th IMF repayment looms closer. A potential default from Greece could see panic selling in the markets and the US Dollar could potentially strengthen as funds shift to safe have currencies (including the Yen and the Franc to an extent). Domestically, the US economic data continues to show a modest recovery. Most importantly, the first quarter GDP stabilized to -0.2% from -0.7% during the third and final revision. The Atlanta Fed’s GDPNow model shows a potential 2% GDP growth from the second quarter onwards which could start to shift the sentiment in the Greenback as the Fed prepares for a rate hike.

