
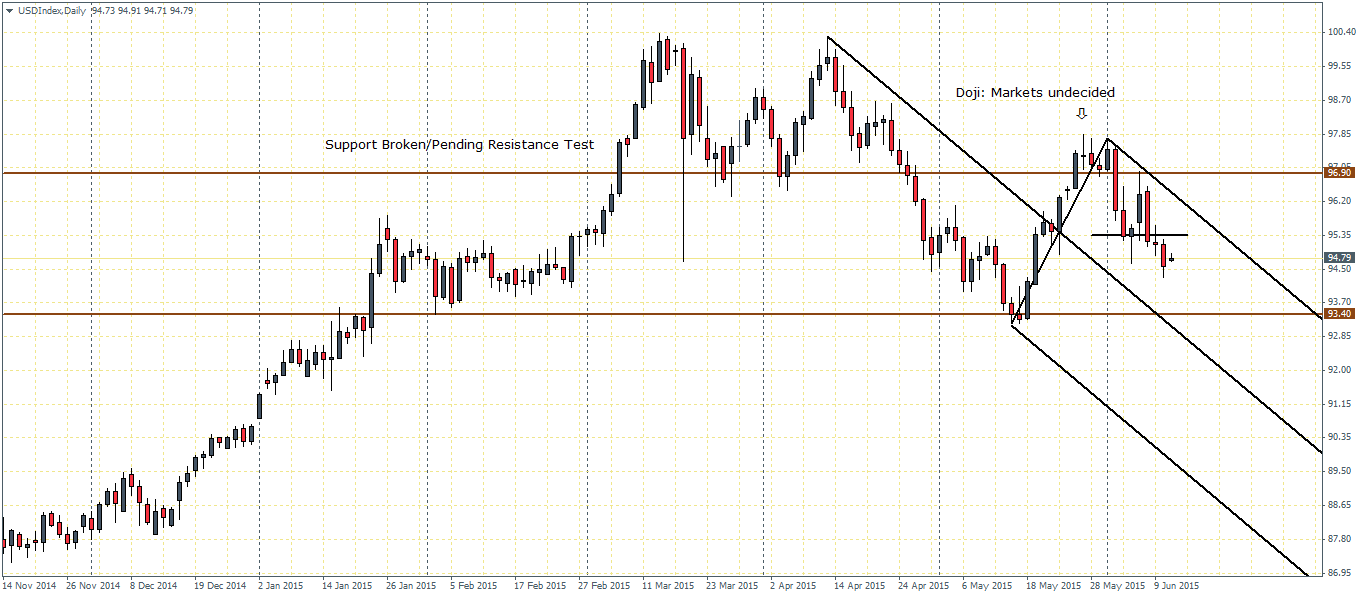
Following up from last week’s technical analysis of the US Dollar index, on the daily charts, we notice a confirmation of the bearish move after the resistance near 96.9 managed to hold prices and also marked by the doji candlestick patter near this level of resistance. What followed was a series of consecutive declines including a minor pullback to 96.9 and a subsequent decline below the lows prior to the pullback at 95.35.
In the short term we could expect a bit of consolidation near or below the 95.35 low but the likelihood of a further decline to 93.7 – 93.4 looks very much a possibility. With ample room between the upper and median line of the pitchfork, we continue to remain bearish on the US Dollar Index towards 93.4 region.
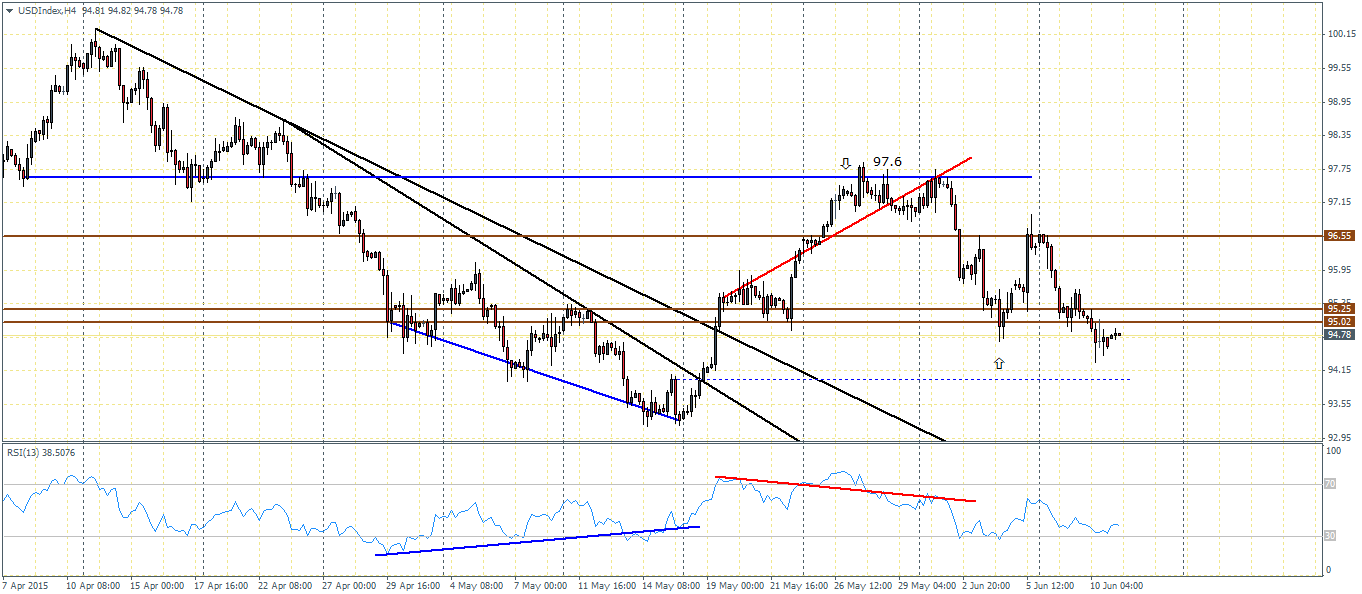
Switching to the lower time frame charts, the 4-hour chart of the US Dollar Index showed that prices consolidated near the support at 95.25 – 95 region but the support gave way. This was initially foreseen by the bearish divergence to the RSI which we pointed out last week.

With prices now below this support zone, we do not rule out further consolidation near this level of support. In the likely event that prices manage to rally above 95.25, we could expect the US Dollar to attempt another rally towards 96.55 level of resistance; while on the other hand, a continued bearish decline below 95.02 will see a dip towards 94, which marks the level of break out from the trend line.
Price action at 94 will be of importance as failure to close lower could potentially turn bullish for the US Dollar Index, albeit price will have to struggle to break above the currently established resistance levels at 95.25 and eventually 96.55.
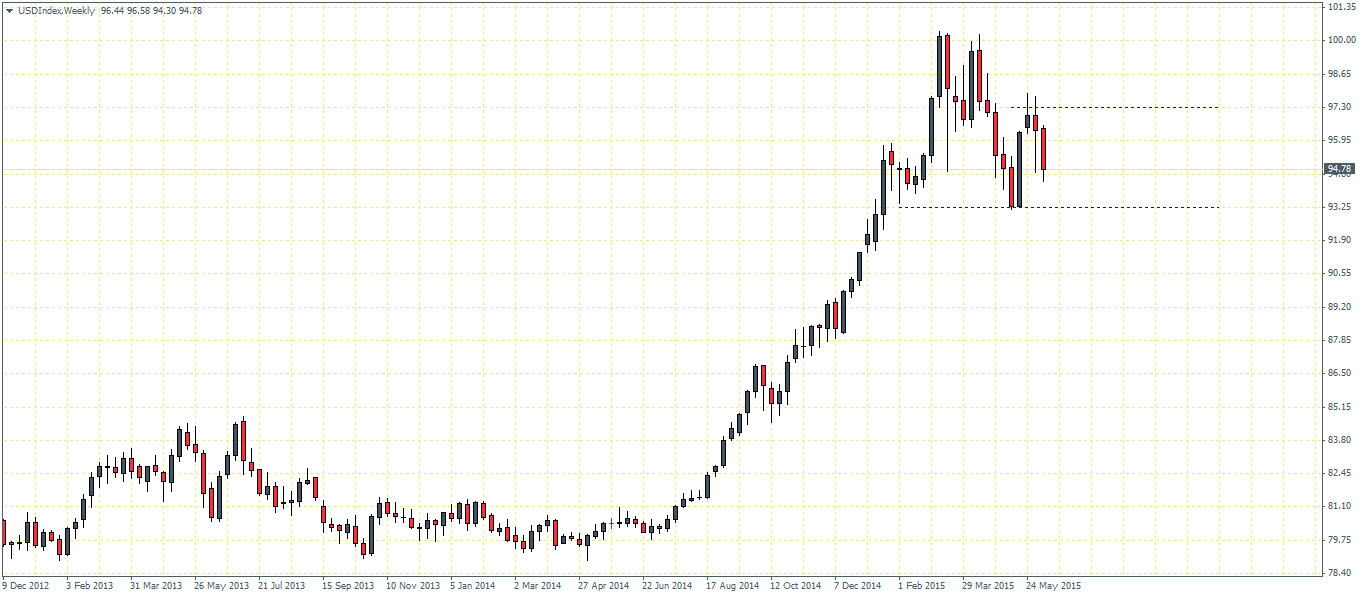
Finally, on the weekly charts we notice the high and lows being set between 97.3 and 93.25 regions. In this aspect, a close above or below these levels will point to the future medium term direction in the US Dollar Index. So far, the weekly charts shows that last week’s price action closed on a bearish engulfing candlestick and was followed through by a decline this week. We can therefore expect the decline to possibly end this week while next week will see the June FOMC meeting which could potentially act as a catalyst for prices as well as set the short term course in the US Dollar Index.
Ahead of next week’s FOMC event, the US retail sales data is due for release later today with expectations pointing to a bullish print of 0.7% growth on core retail sales while a 1.1% growth on the headline.

![Credit Card 160×600 [EN]](https://assets.iorbex.com/blog/wp-content/uploads/2023/06/13144507/Blog-Banner_EN-Banner_160X600X2.webp)