
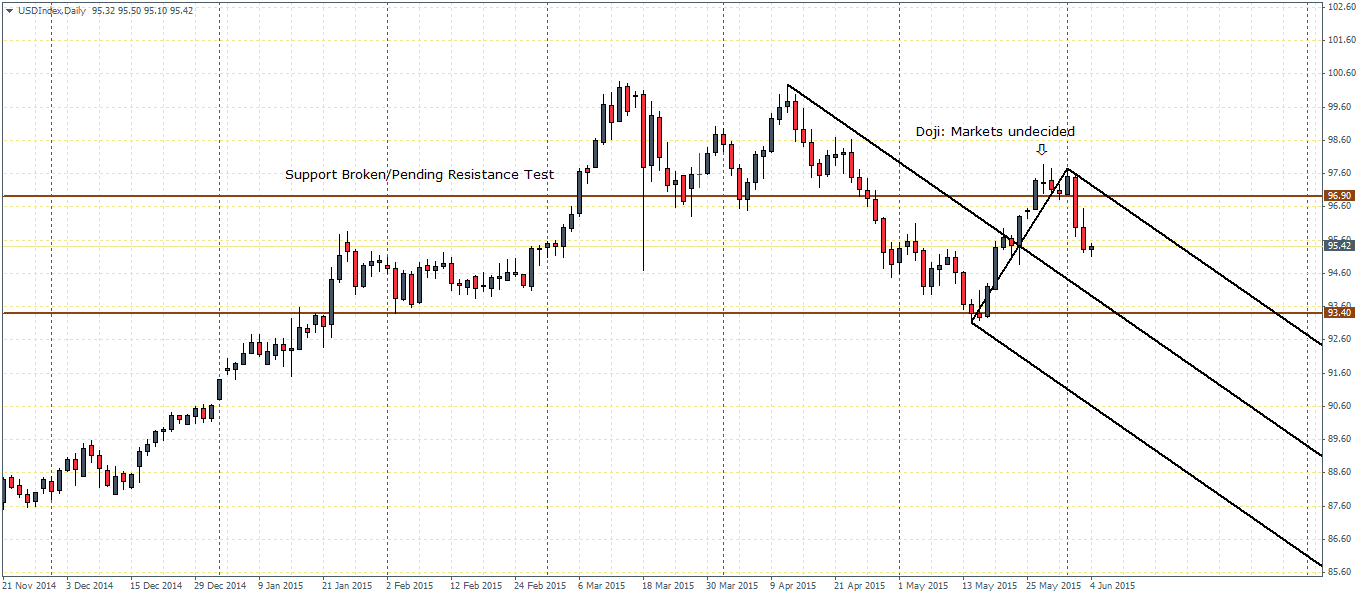
The US Dollar Index seems to have given way to the sellers as the Doji candlestick we noted in last week’s analysis saw price failing to push higher. Instead, price closed back below the 96.90 support/resistance level, marked by a strong bearish candlestick. With price now trading at 95.43, the next support to the downside comes in at 93.40, while the previously broken support at 96.90 could possibly act as resistance in any attempts to rally.
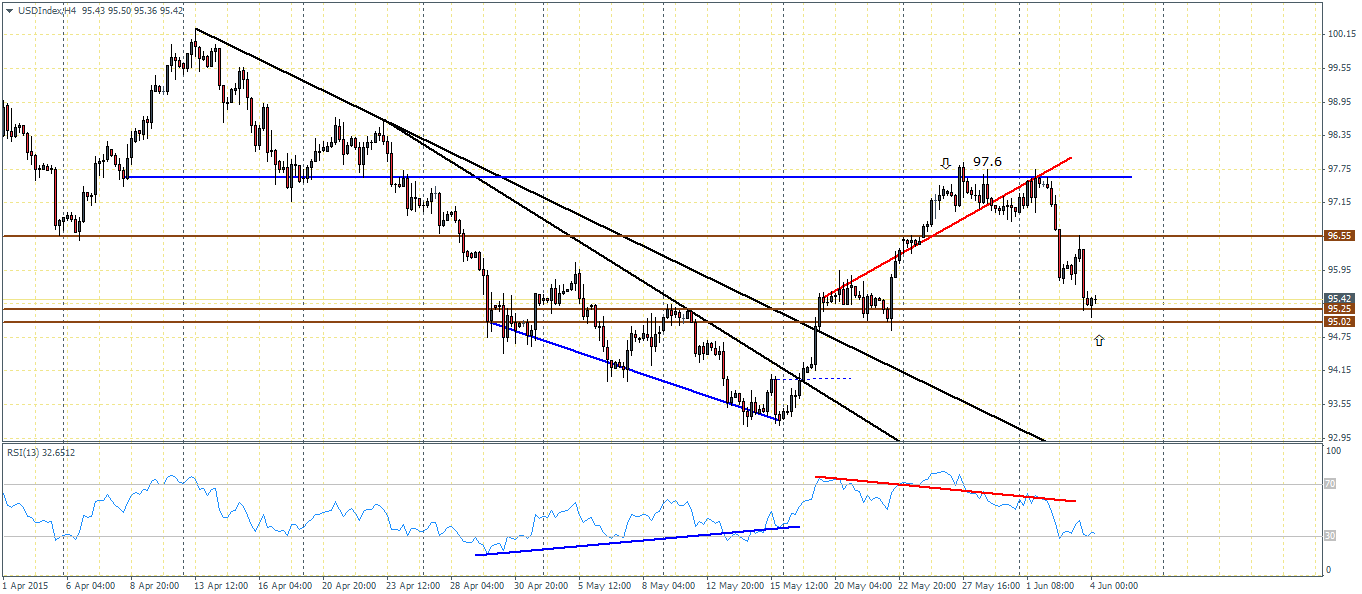
Using the pitchfork analysis, we notice that the current price level at 95.5 makes for a short – medium term support level and therefore we could expect to see some kind of bounce. However, a break above 96.5 is critical in order to see new highs being posted. Failure to break above 96.5 could see the US Dollar Index, gradually decline back to 93.4, which marks the horizontal level of support as well as a dynamic support from the falling median line.
On the 4-hour chart time frame, we notice that prices rallied as far as 97.6 after breaking out of the falling trend lines, but failure to break above 97.6 saw the US Dollar index promptly decline lower after breaking below 96.55.

Plotting the RSI indicator, we notice that this downside move was validated on the bearish divergence. With price action now trading back at the 95.25 – 95 support level, the US Dollar Index needs to hold above this support for any hopes of a rally. A break below 95 will see the short term bears come into the market to push the US Dollar much lower.
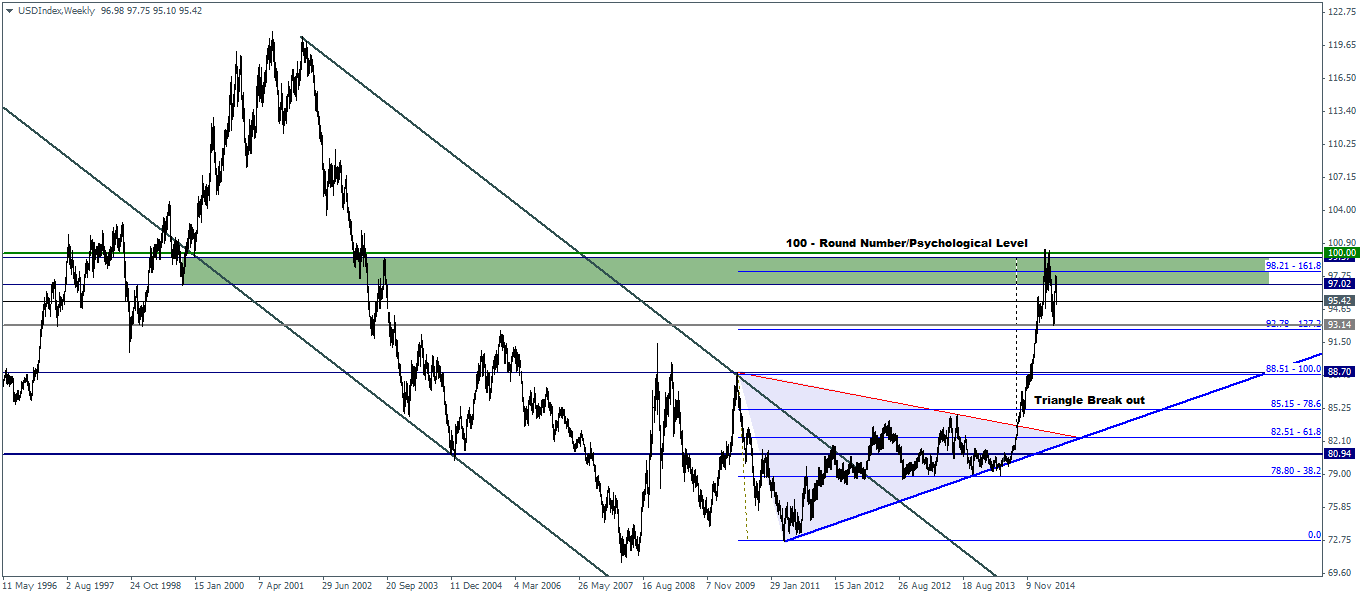
On the weekly charts, showing the long term view of the US Dollar Index, we notice that price has been pretty much moving in a range between the 100 psychological level and the 93.15 – 92.5 support level. This will be a key longer term price level to watch for as a break lower could see the US Dollar eventually decline to 88.5, a level of support from the falling price channel. Alternatively, if price manages to hold near 93.15 – 92.5 we could anticipate a possible break of the psychological resistance of 100 leading to the US Dollar Index posting fresh gains.
The main fundamental risk to the US Dollar is undoubtedly the nonfarm payrolls numbers due for release tomorrow. Yesterday’s ADP numbers managed to beat estimates by a small margin but the markets barely reacted to the better than expected private payrolls, perhaps due to the downward revision of the previous month’s numbers. In this aspect, the US Dollar Index would be focusing not only on the job numbers for the month of May but also any revisions to the previous months not forgetting the unemployment rate change as well. Ahead of the NFP data tomorrow, today’s economic data from the US include the weekly jobless claims, nonfarm productivity and challenger job cuts all of which could potentially influence the prices ahead of tomorrow’s main event.

![Credit Card 160×600 [EN]](https://assets.iorbex.com/blog/wp-content/uploads/2023/06/13144507/Blog-Banner_EN-Banner_160X600X2.webp)