The US Dollar Index continues to remain weak and to date has posted close to 16 straight sessions of declines with minor corrections in between. A continuing trend that we notice since the past few weeks has been a strong selloff in the US Dollar on weaker economic data and we expect this trend to continue, heading into the important April jobs report.
Yesterday, the ADP private payrolls were released, which saw a disappointing 169k jobs being added in April, below estimates of 199k. March numbers were revised lower from 189k to 175k. Despite the disappointing figures, readers should note that the ADP hasn’t had a good track record of the jobs report when compared to the NFP released by the BLS. In this aspect, Friday’s job numbers could still spring a surprise in the markets.
At the time of writing, the US Dollar Index was trading at 94.25 and posted a strong bearish candlestick yesterday. The 4-hour chart shows what looks like a break out from a bearish flag, which points to a correction to 92.5. Currently, we notice a small support forming at 94.10 and we could therefore expect to see a minor bounce although it is likely to be short lived. However, a break below 94.10 could see a swift decline to 92.5.
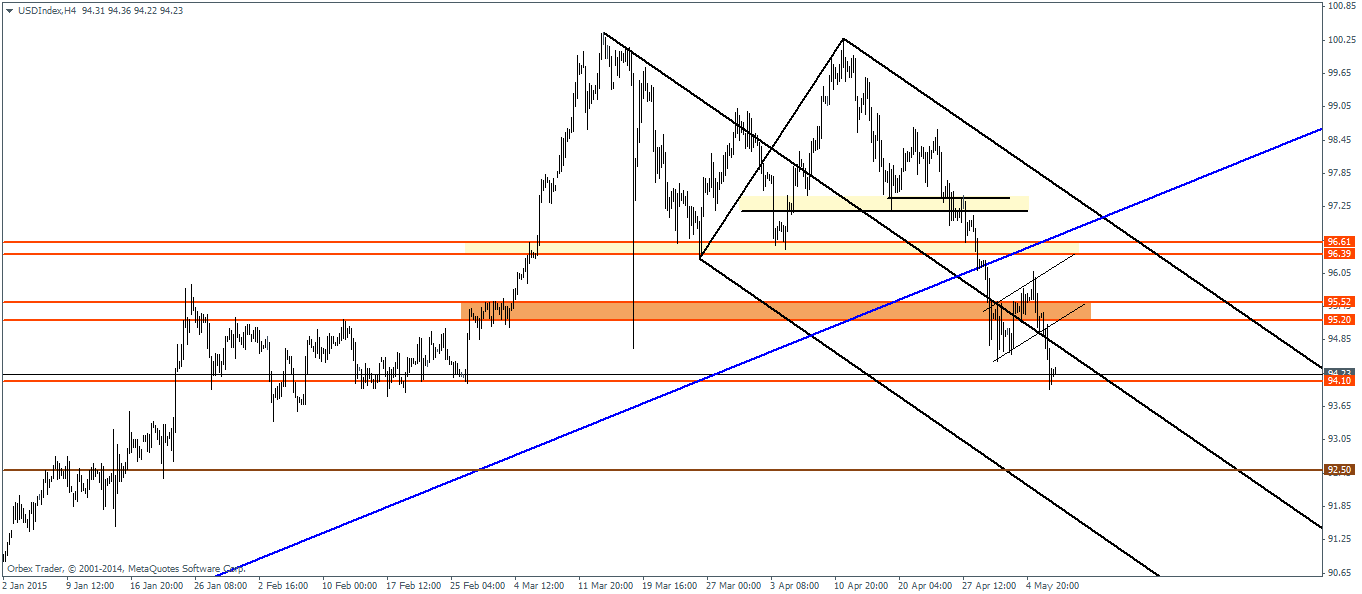

The most interesting aspect of this analysis is whether the US Dollar Index will head to the major support at 92.5 ahead of the Friday jobs report. In the event such as scenario plays out, considering that the Index is trading at a major support, we could expect a possibly bullish print on the jobs numbers. Alternatively, if the US Dollar Index doesn’t reach 92.5 before Friday’s release, we could expect to see a bit of consolidation take place between 94.10 through 92.5 resistance and support levels.
Above 94.10, a major resistance sits between 95.5 through 95.2 levels and in this aspect, it will be crucial to see how the US Dollar Index reacts to the 94.10 support and especially whether it will manage to close below this level on a daily chart.
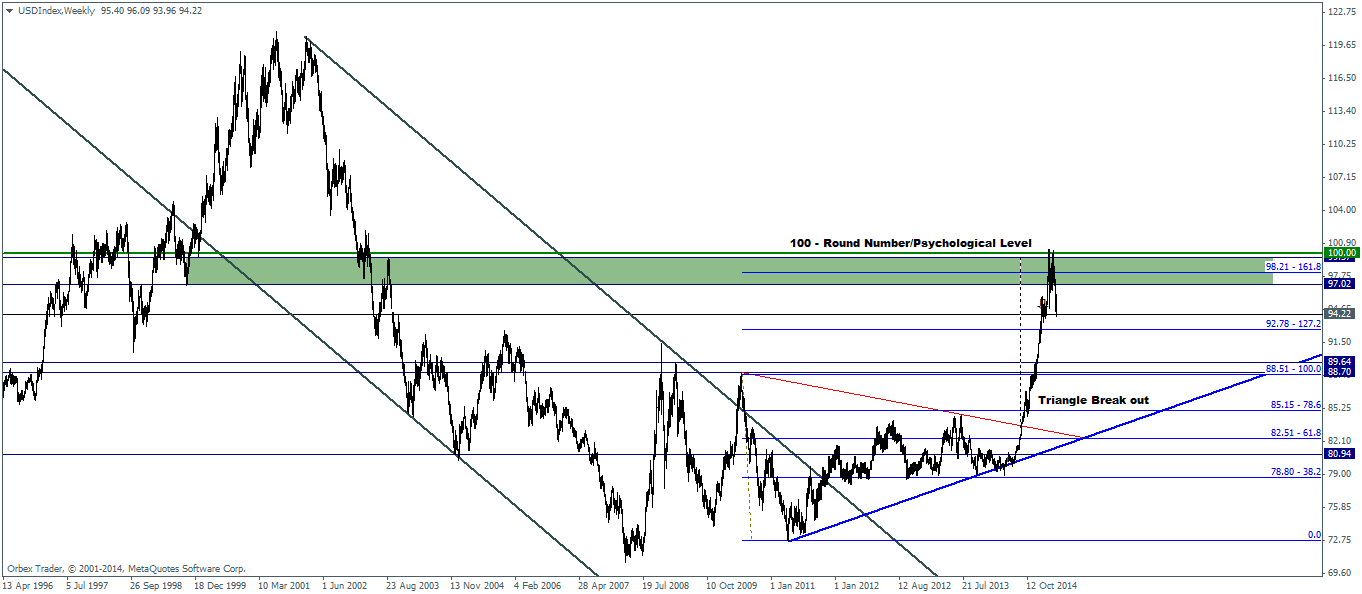
The weekly chart for the US Dollar Index gives a better perspective of the market, as we notice a minor double top formation near the 100 psychological price zone followed by a sharp decline. The weekly charts for the US Dollar Index points to 92.78 as the immediate Fib number, which could act as support, followed by 89.64, which marks the 100% Fib level and also a longer term support and resistance level.
In terms of economic data, the US calendar is light today with only the weekly unemployment claims due to be released with no data scheduled until Friday’s NFP release. This makes the weekly unemployment claims somewhat important to make note of as a continued good print beating estimates could start to see some buying in the US Dollar Index.

![Credit Card 160×600 [EN]](https://assets.iorbex.com/blog/wp-content/uploads/2023/06/13144507/Blog-Banner_EN-Banner_160X600X2.webp)