
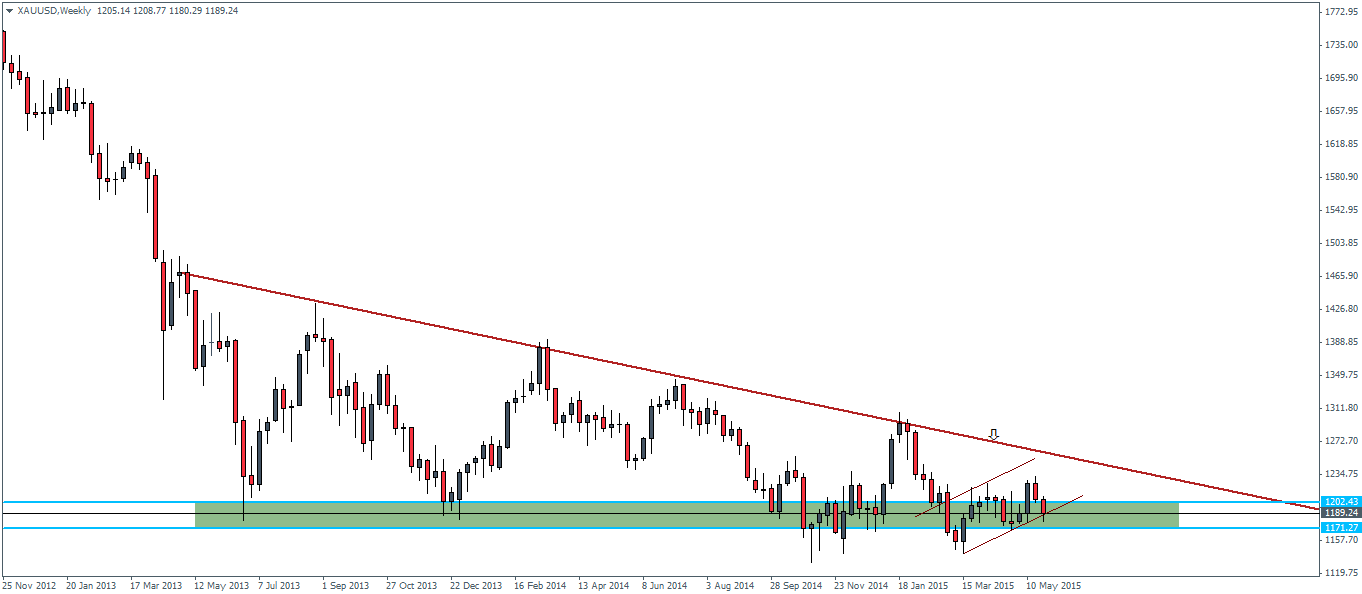
Gold futures have been consolidating within a larger price range of around 1230 through 1185 for the past couple of weeks indicating a possible break out from this range. On the weekly chart time frame, Gold futures have been trading near the major support level of 1200 through 1170 and is possibly one of the reasons of the sideways price action taking place. However, this consolidation is pointing to a potential bearish flag on the weekly chart but the 1185 – 1170 level needs to be cleared for the bearish flag to be validated. In the event the bear flag from the weekly charts does indeed result in a break out, the minimum price target we expect is towards the 1000 price level.
Looking to the 4-hour chart, we notice that price barely made it to a significant point 5 in the larger rising wedge/triangle pattern after prices were capped near the 1213 level of support/resistance. Eventually, Gold futures broke out from the triangle and broke below the 1199 – 1200 price level. At the time of writing, we notice a strong bounce from the 1180 support level although price didn’t completely dip to this support zone. We could therefore expect to see a retest to 1200 handle before prices eventually decline to the 1180 – 1174 price level.
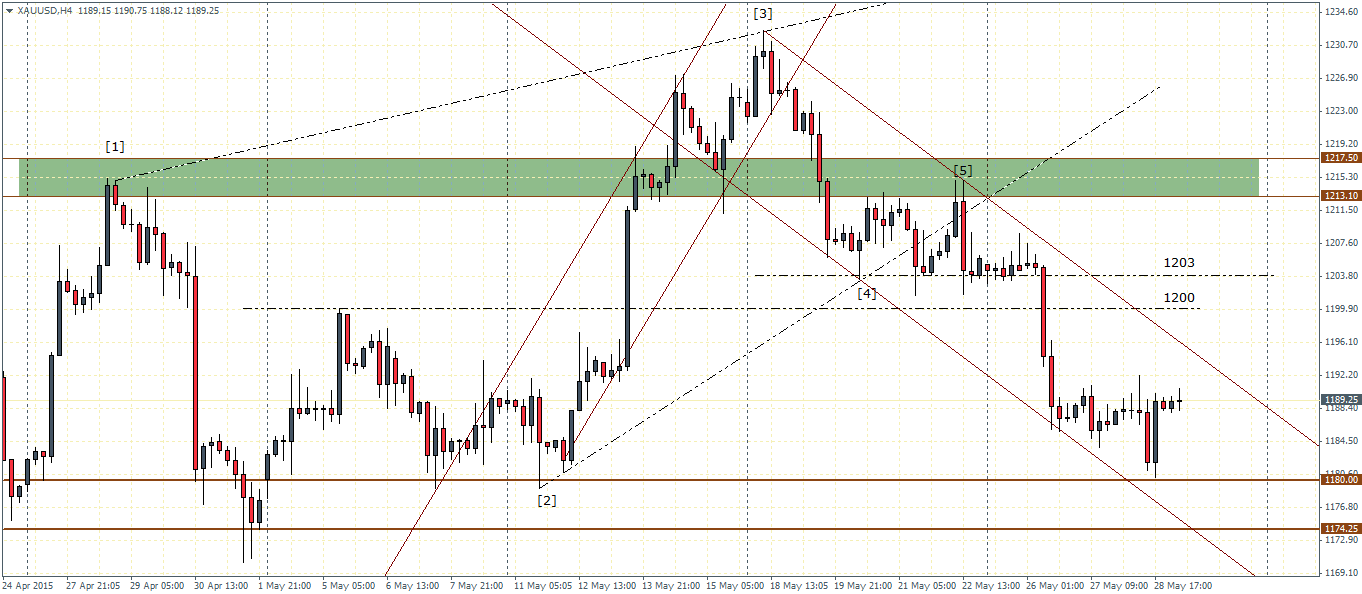

Plotting the falling price channel on the 4-hour chart also shows the broken support zone near 1203 – 1200 level which could be tested for resistance before we can expect to see prices decline below 1180.
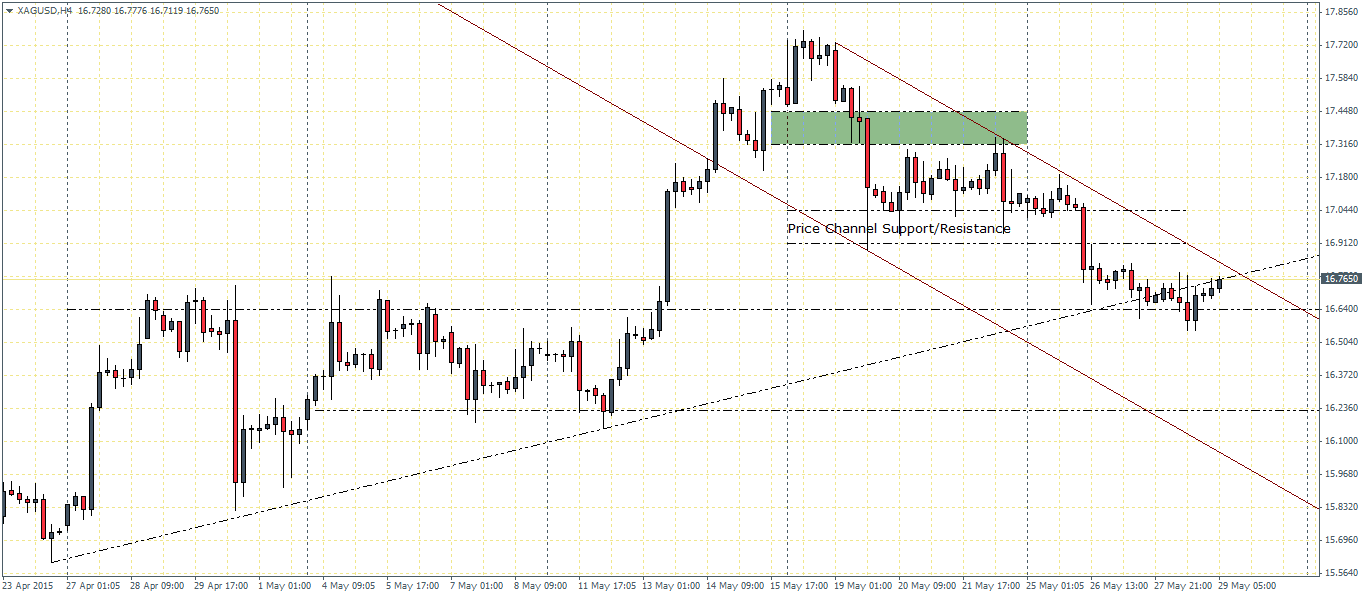
Silver futures broke out from the ascending triangle pattern and rallied towards 17.72 the minimum price target of the ascending triangle. Prices however failed to hold up at this level and promptly declined back to the major support level near 16.64. Price has also broken the rising trend line which could now act as resistance.
If the trend line holds the rally near 16.76, Silver futures could see a sharp decline below 16.64 support which could then target 16.236 where the next support level comes in.
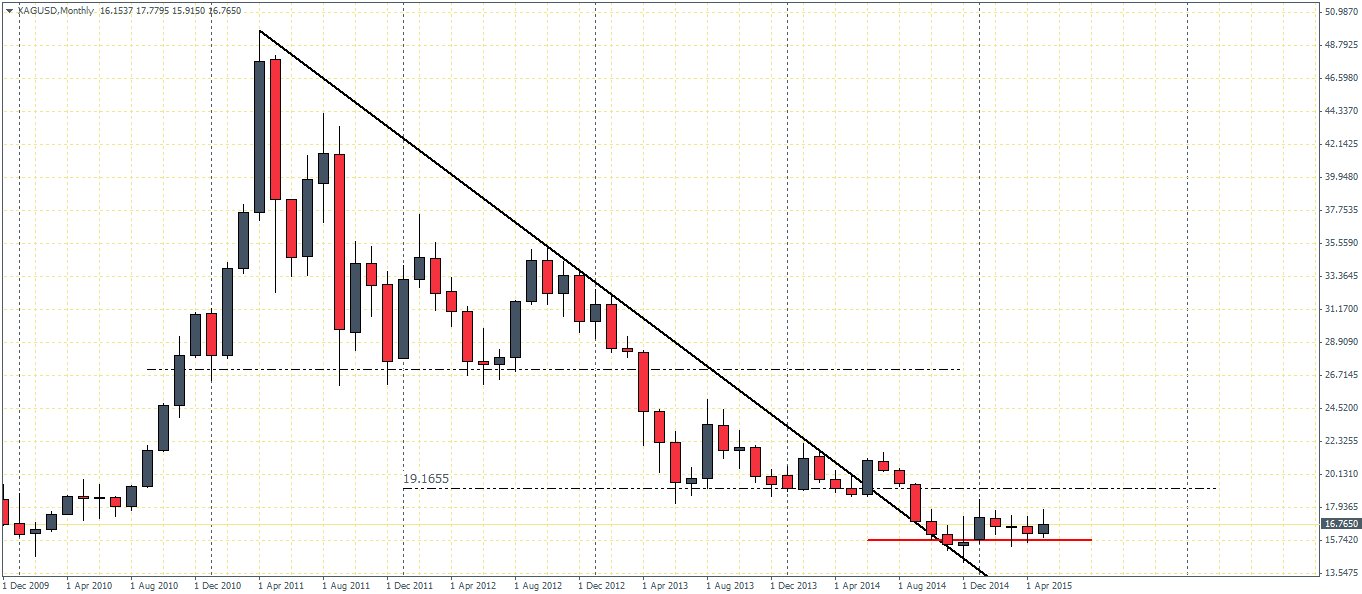
On the monthly chart for Silver, we notice that the longer term falling trend line was broken in the past couple of months and we expect to see a possible test to the 19.165 support level, which could be now tested for resistance. So long as prices manage to hold above the 15.74 support low, the upside move towards 19.165 could be possible.

![Credit Card 160×600 [EN]](https://assets.iorbex.com/blog/wp-content/uploads/2023/06/13144507/Blog-Banner_EN-Banner_160X600X2.webp)