
The precious metals markets has been particularly choppy for the past few weeks with price action showing that Gold and Silver futures have been trading within a broad range with no clear direction in sight, despite the broader weakness in the US Dollar Index. However, if we consider the recent rout in the Bond markets and the shift in the markets, moving away from a deflationary environment to one of rising interest rates, Gold futures in particular have been relatively flat all along.
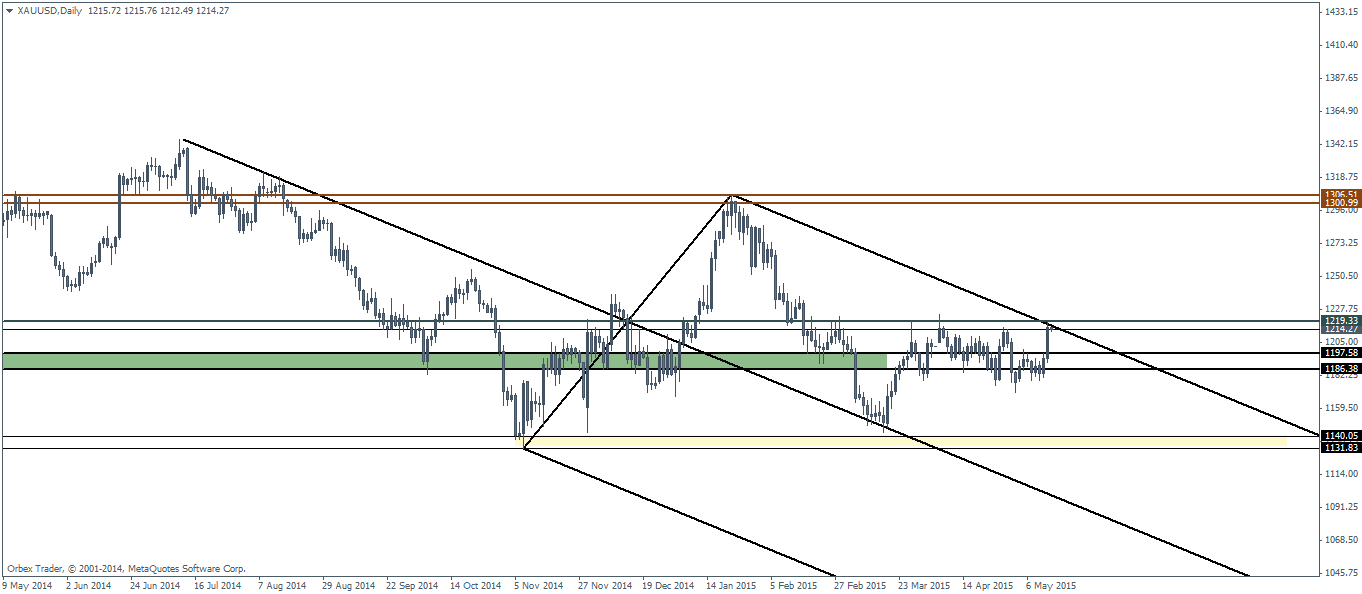
The chart below shows the daily time frame for Gold futures where we notice that price has been trading within the highs and lows of 1219 through 1170. The pitchfork plotted on the daily chart also shows that this region makes for a strong support and resistance level. After prices initially broke through this level the first time, Gold futures declines sharply to make a low towards 1145 level and managed to find support near the median line, which saw prices heading back to the familiar support and resistance level.
At the time of writing, yesterday’s candlestick showed price rallying back towards the upper median line near the price level of 1219. A break out from above this price level is needed in order to bring more conviction to any further upside move in prices. As such, we wait for a break out above 1219 and potentially expect to see a retest on this break out before prices can move higher towards the next longer term resistance at 1300.

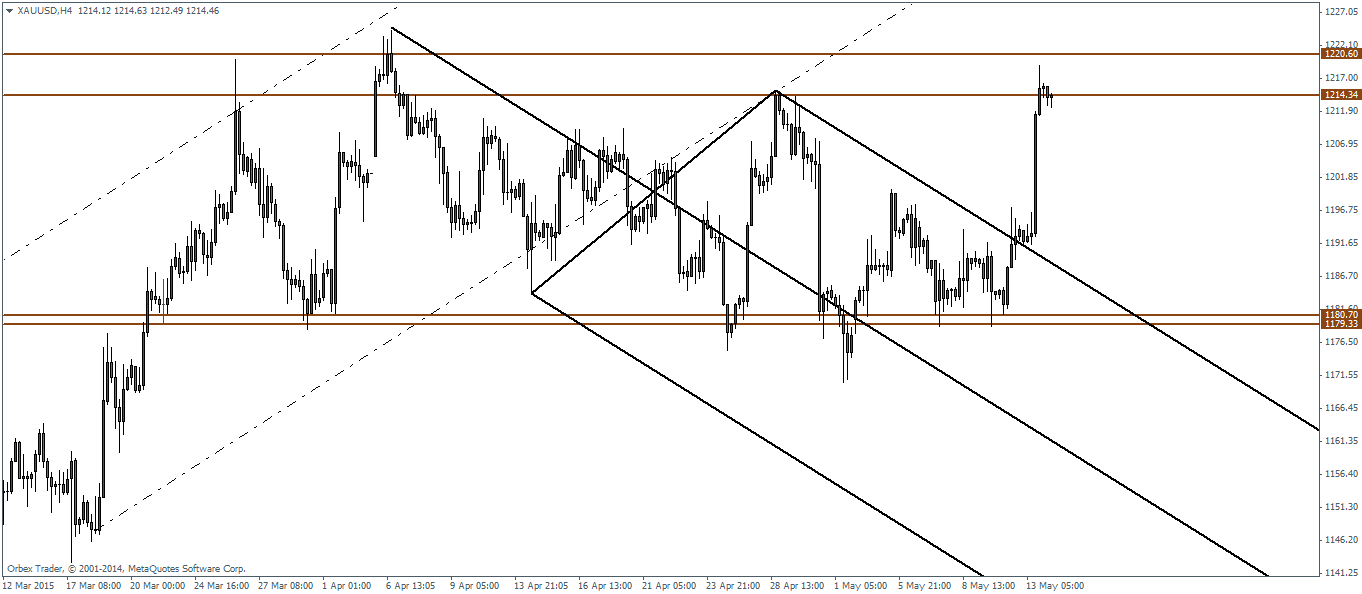
The 4-hour chart for Gold shows the ranging price action in a more visible fashion as we notice that price has been bouncing off the support and resistance levels after breaking out from the rising price channel and eventually finding support at 1180 price zone and breaking out from the upper median line.
With price action now back at the main resistance between 1220 – 1214, we expect to see some kind of consolidation before the next course of direction is determined.
Silver futures, on the other hand looks poised to potentially threaten the head and shoulders pattern that was taking shape over the past couple of quarters. With price seeing a reversal near the 15.72 region, the following rally saw a test back to the main resistance level or the peak of the right shoulder at 17.
Technically, as long as prices hold here, there is still a chance of a move to the downside and the head and shoulders pattern would still hold. In this aspect, the price action in Silver futures on the daily charts would be one to watch out for.
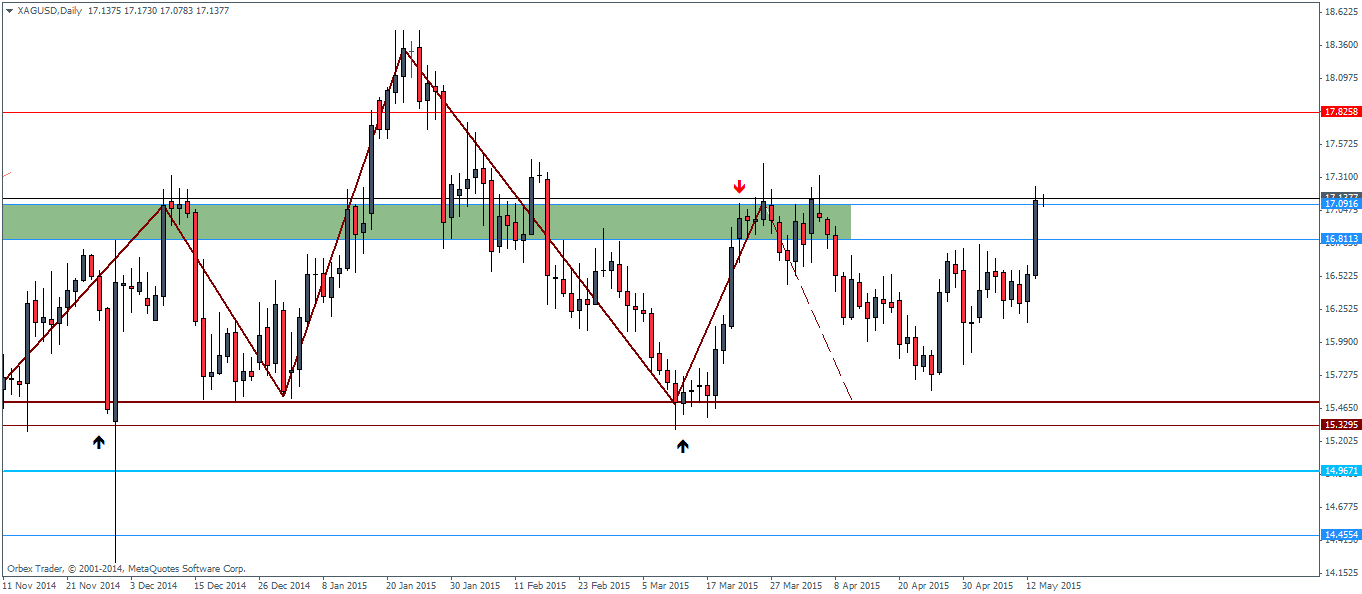
On the 4-hour chart for Silver we do notice a possibility of a double top taking shape. But for this double top to be validated, we will have to see a close and a reversal near the current levels of 17.13. The double top pattern would however be validated only on a close below the neckline at 15.7.
Alternatively, a break above 17.13 through 17.22 could turn bullish for Silver futures with the next resistance coming in at 18.

