
Crude Oil, still range bound between $62 and $58
Crude Oil futures remained range bound for the most part of last week after forming a top near the $62 price level. Price action last week simply saw prices ranging between the 62 and 58 price levels, practically trading sideways for close to a week.
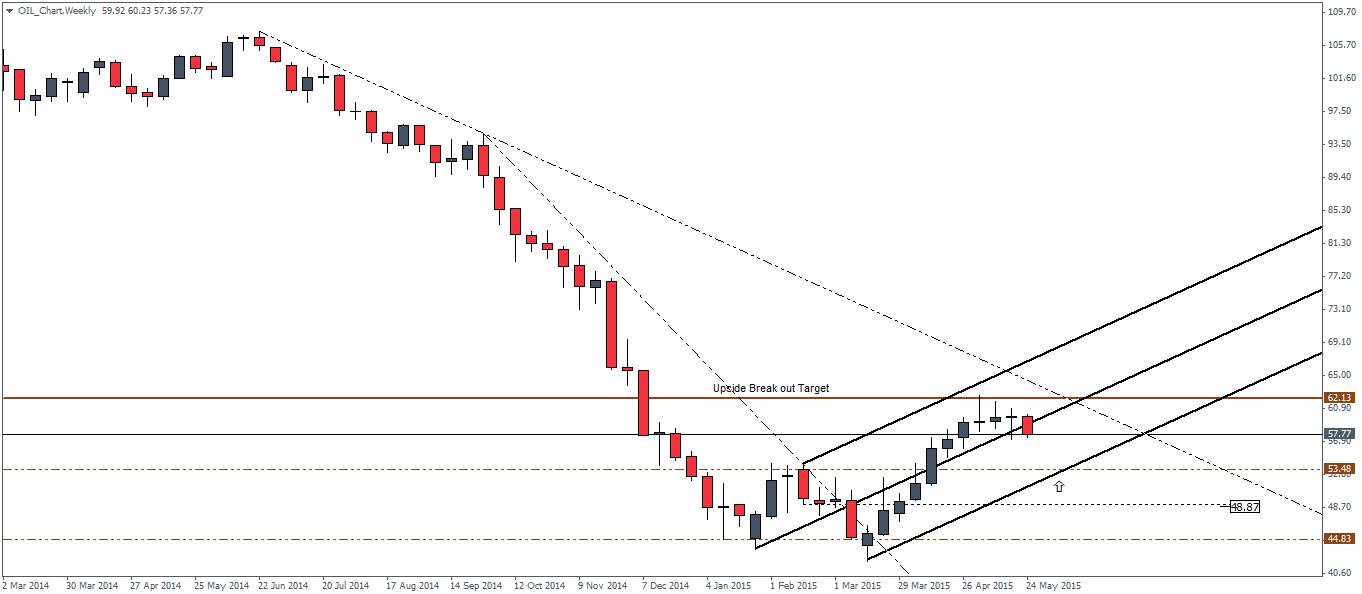
The weekly chart for Crude Oil shows the reason why as we notice the weekly candlestick closing with three weeks of near doji type of price action after a brief touch to the $62 price level. After three weeks of sideways price action, this week saw a reasonably bearish candlestick taking shape with still two sessions to go. The weekly chart shows that the support level comes in at 53.48 – 53.5 level which if holds could see another attempt for Crude Oil to push higher. A break below 53.5 will see Crude oil likely to decline lower towards 48.5 and could hint to the end of this corrective rally to 62.

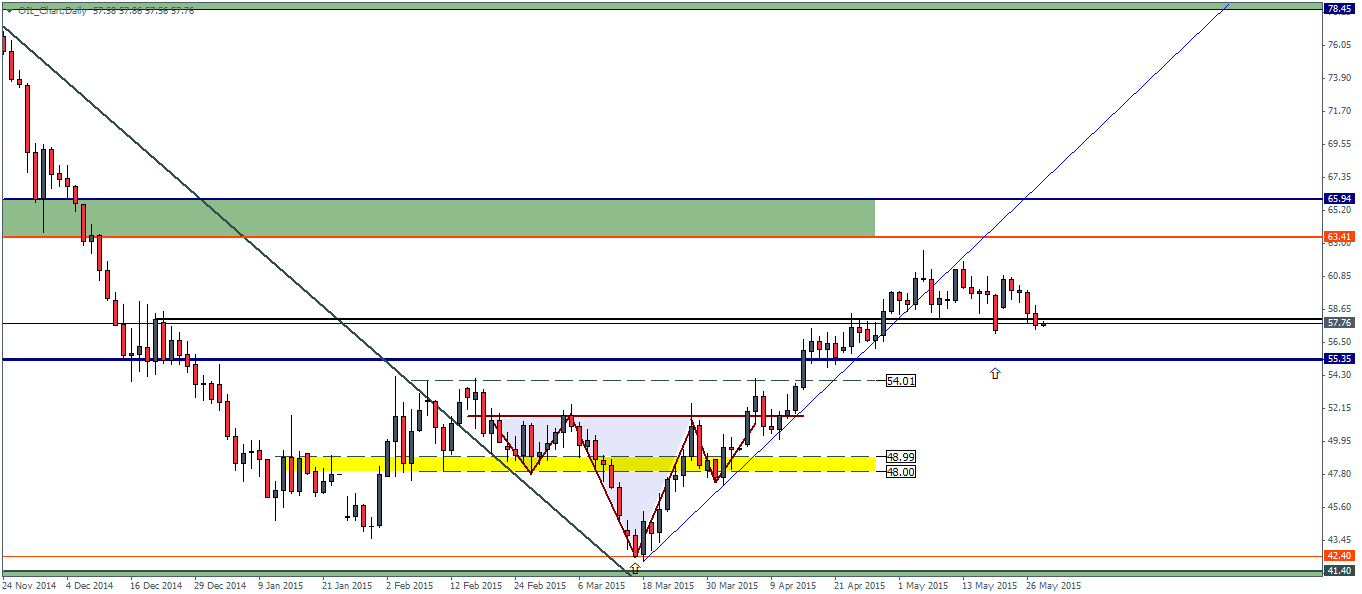
On the daily chart time frame, we notice that after the rising trend line was broken, connecting the higher lows from 18th March through 1st of April, price action broke out from this rising trend line and found a short term support near 58, which saw prices bouncing off this level. However, the failure to break higher ground showed that price action was indeed likely to break lower. At the time of writing, Crude Oil was trading at 57.76, just below the $58 handle. A daily close below the $58 level could see Crude Oil dip to 55.35 support level or even down to 54.
If this support level 55.35 – 54 holds, Crude Oil could attempt another rally to the upside targeting $58 which could come in as resistance. On the other hand, should the support below 54 fail to hold prices, Crude oil could see some choppy price action before eventually settling for further declines with the next major support level coming at 49 – 48 level.
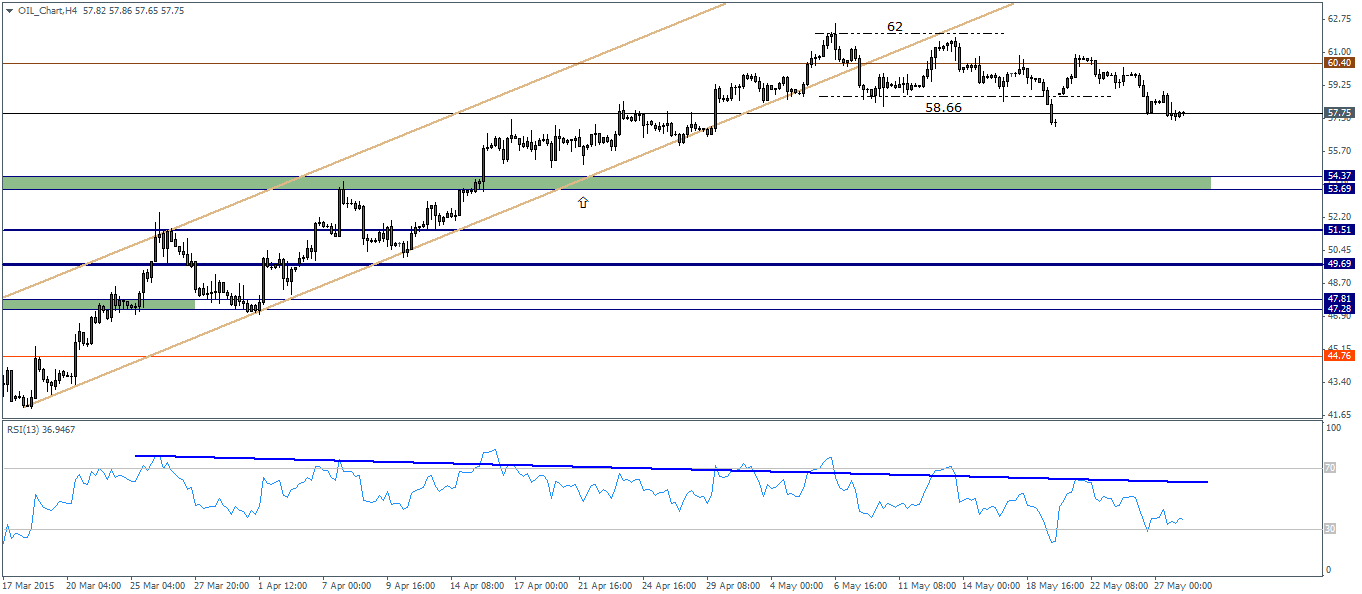
The 4-hour chart for Crude oil futures shows that the RSI failed to confirm the highs near 62 level which resulted in a strong bearish divergence taking shape. A break below 58.66 or 58.5 will see prices decline towards 54.37 with the possibility of declining to 51.51 which marks the end of the correction.
As such, for the moment, Crude oil futures could indeed be heading lower towards 51.51 price level after a break of 54. The price point of 51.51 will be important for Crude oil as any declines lower could most likely indicate that Crude oil futures could be looking at a continued decline and perhaps the downtrend gaining momentum.

![Credit Card 160×600 [EN]](https://assets.iorbex.com/blog/wp-content/uploads/2023/06/13144507/Blog-Banner_EN-Banner_160X600X2.webp)