Gold futures look to have settled near the 1200 level after most of last week saw prices bouncing off this level with neither the bulls nor the bears in control. With Gold being heavily influenced by the US Dollar, this sideways market seems to have an answer from the Dollar index, which itself has been bouncing off the brief (second) retest to the 100 level.
On the 4-hour chart, Gold is still in the upward price channel but there are increasing chances that a break out could see the potential larger scale bull flag come into play. This chart pattern if validated could pose large upside potential in Gold prices, to as much as $1250.
Right below current price, we have a strong support/resistance level at 1187 through 1183, which is likely strong enough to hold any declines from the current levels.
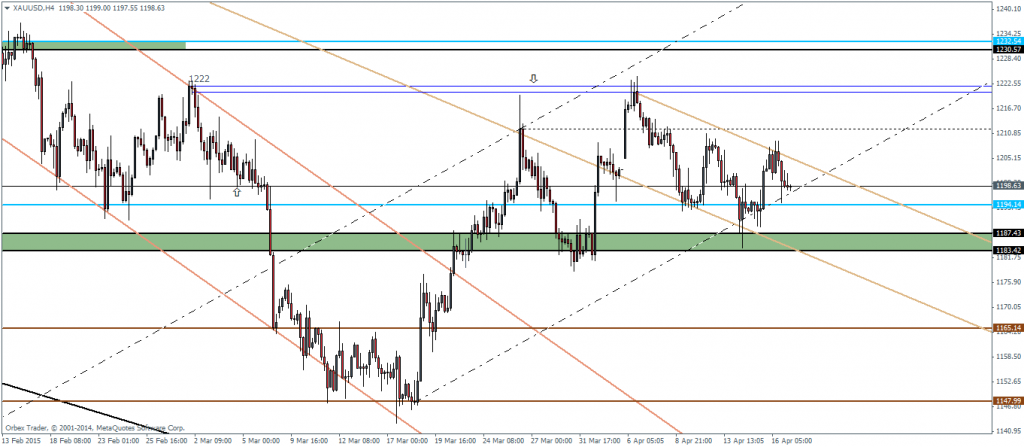

Gold, H4 Charts – 17/04
Within the same chart, we also notice a larger version of a bear flag in play, with the current uptrend shaping out to be a flag. When considering both these scenarios it looks very evident that Gold is probably heading into a volatile period and therefore makes more sense to trade Gold on a lower time scale such as an intraday play rather than trade for the longer term.
We do know that unless we see a break below 1187 Gold could pose an upside risk and a break above 1210 will validate this view.
The Daily charts in Gold perhaps give a clearer picture with the bear flag being more evident. However the daily candlesticks continue to print bullish engulfing candles especially in this week, which is indicative of a possible upside gain. Therefore, it is best to wait until Gold breaks the price channel and a retest to 1197 or perhaps 1200 will be the key from the daily charts for any validation to the larger bearish flag.
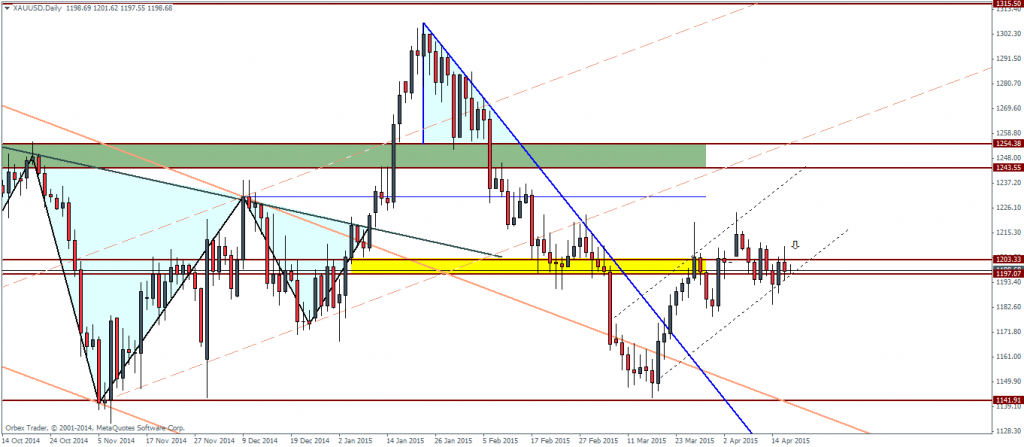
Gold, Daily Charts – 17/04
Silver – Technical Analysis
Silver futures continue to form the larger head and shoulders pattern on the daily charts. For now, the right shoulder seems to have been formed with the peak capped near the 17 – 16.81 levels and also identified by a lower high.
The current consolidation near the right shoulder is likely to provide more clues from a lower chart time frame.
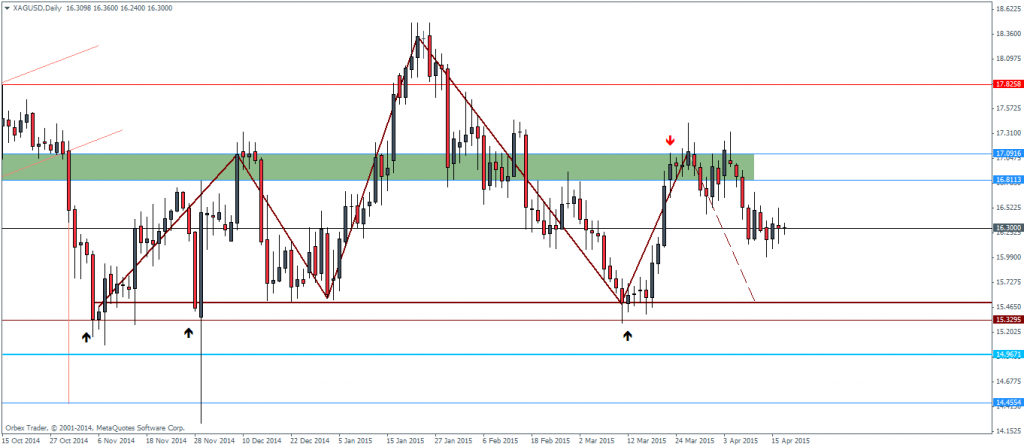
Silver, Daily Chart, 17/04
The 4-hour chart for Silver shows price consolidating near 16.6 through 16.18 levels, which has formed into a descending triangle pattern. Taking into consideration the larger move, we get a minimum downside target towards 15.56 which sits just a few points above the main neckline of the head and shoulders at 15.42 levels. This is a very clear indication that a successful downside break out for Silver on the H4-charts will continue to validate the longer term head and shoulders patterns from the daily charts.
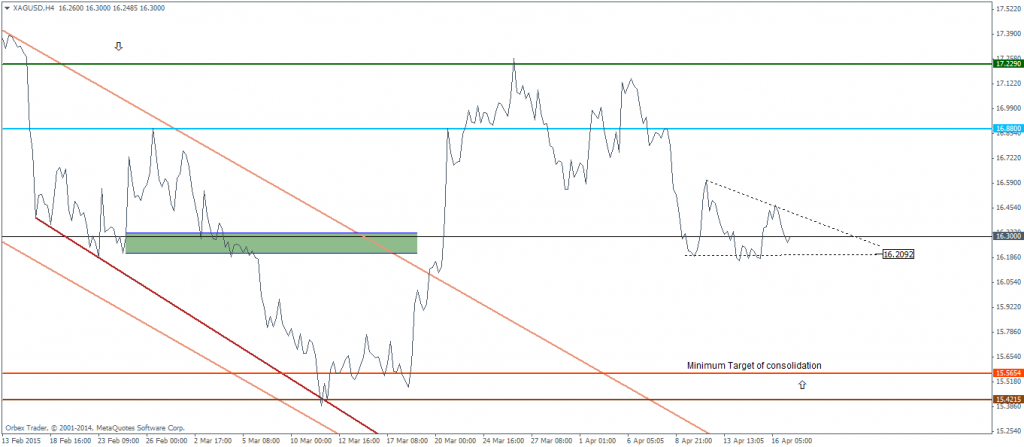
Silver, 4-hour Chart – 19/04
The main risks to both Gold and Silver update comes from the US CPI data that is due later today. Since last month, CPI data has managed to turn around and a continuation of this trend is likely to keep the Dollar rally alive. However, in lieu with the recent economic data misses, if the CPI too falls below estimates, it could trigger a continuation of the weakness in the US Dollar and could in turn boost metal prices such as Gold and Silver.

![Credit Card 160×600 [EN]](https://assets.iorbex.com/blog/wp-content/uploads/2023/06/13144507/Blog-Banner_EN-Banner_160X600X2.webp)