The US Dollar Index came under pressure this week as the high-risk event from the FOMC kicked off. While initially the markets reacted to the dovish tone of the Federal Reserve, normalcy returned as the markets understood that a US rate hike is still on the table, albeit with the consensus divided between a June or a September rate hike.
On the release of the Fed’s monetary policy statement, the US Dollar index, which was trading near the highs of 100, dropped off sharply to dip to 94.68. The weakness in the US Dollar however faded with the turn of the day as the Greenback managed to trade back to the pre-FOMC levels, closing yesterday at 99.35.
The volatility in the Greenback, however, indicates the rising risks of pricing in a rate hike and any hints of hesitation could potentially trigger sharp reactions from the US Dollar Index.
Technically, the US Dollar Index’s weekly charts still look strong trading near the 100 psychological level. However, it seems like momentum is slowly stalling and we suspect this to be the case until next week when the US CPI data is released followed by the March jobs report due in early April.

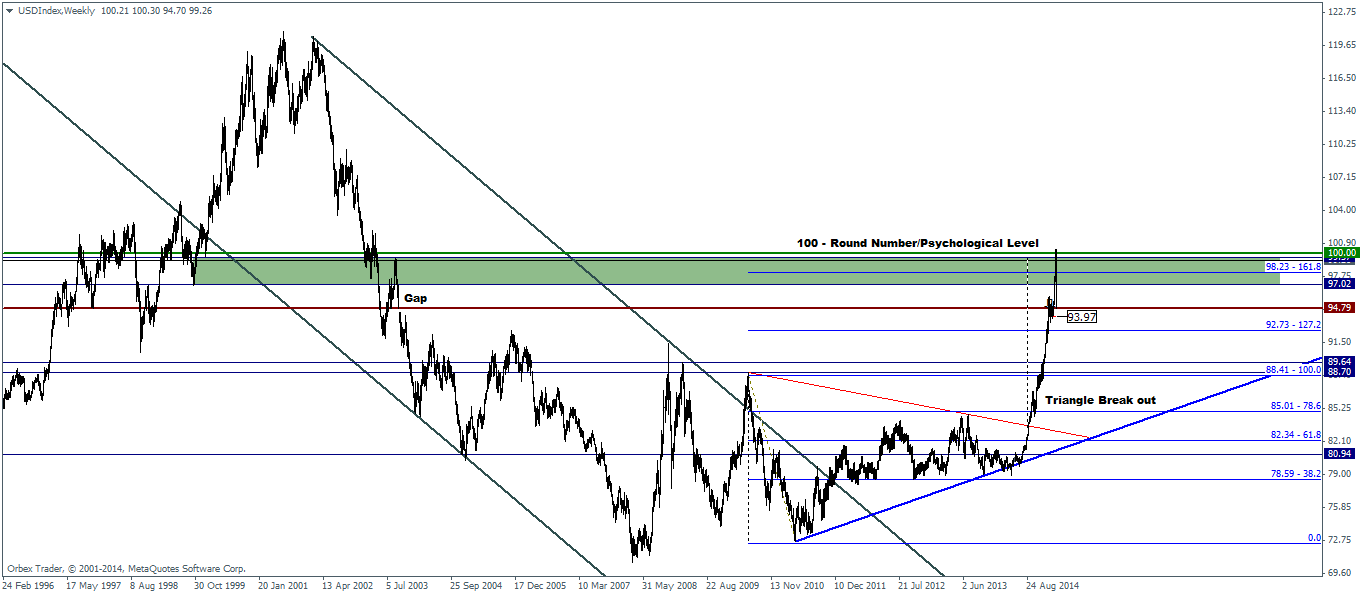
From the previous week’s analysis, as you can see the above weekly charts hasn’t changed much, which goes with our view that either the fading momentum is the sign of a longer-term weakness setting into the Greenback or is perhaps a temporary pause before a new leg in the rally ensues.
With the Federal Reserve clearly specifying that the rate hike would be data dependent, the markets will be eagerly watching the inflation numbers, which includes both the CPI data as well as the PCE numbers along with the jobs report, as these two indicators are now the main drivers for a US interest rate hike.
The monthly chart of the US Dollar Index gives the bigger picture and makes a very interesting case.
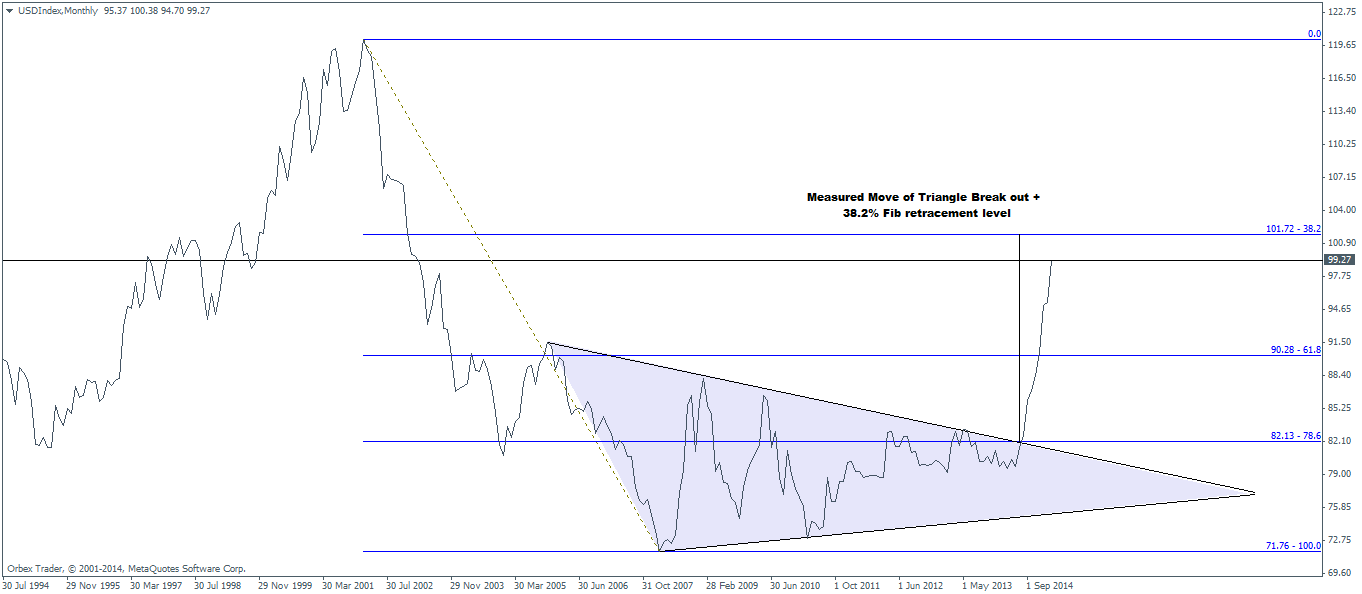
In the above chart, we notice the triangle consolidation pattern that was taking shape which lasted for close to a decade, starting around 2005. The breakout from this consolidation pattern has been sharp and the chart shows that price action did little to retest the broken resistance levels for support on its way up.
We also note that the price point at 101.72 marks the 38.2% Fib retracement level of the previous down leg. This level is also the same as the measured move from the triangle pattern as well.
The above chart, simple as it looks begs a difficult question as to whether the Greenback is in fact looking for a major correction from the monthly charts. Those reading this article should probably keep the above 101.72 level in mind as maybe, the monthly or weekly candlesticks patterns near this level could offer early clues if and when potential weakness sets in.

