
Crude Oil nearing its final target of $32.54
After what seemed like a bullish month for Crude Oil in February sparking talks of a possible rebound in prices, Crude oil futures continued its sharp descent early this month. The monthly price action for Oil chart shows that the final objective of the major triangle break out from Crude oil is nearing its completion at $41.69/41.7 levels initially followed by $32.54.
With job layoffs in the energy sector slowly building momentum, the Shale Oil and other companies that rely on the more expensive methods of oil extraction could further feel the squeeze once prices drop below the $40 handle. The decline in prices could also potentially offer some short term impact on inflation as well.
The support at $41.7 is likely to see some kind of a bounce considering that the technical level is a multi-year support level but any bounces are likely to remain subdued until the final objective to $32.54 is met.

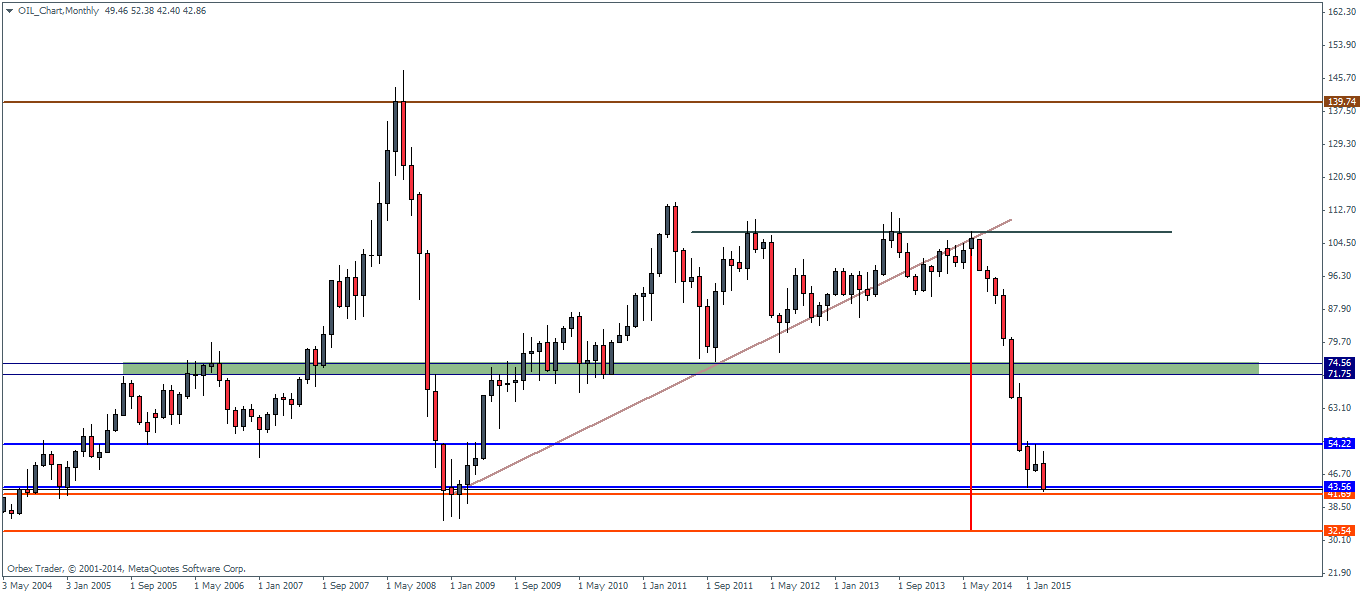
From here on, it is anyone’s guess as to where Crude oil prices are going to head next. Further down south or a build up in the bullish momentum. To the upside, the rally is likely to last to as high as $71.75 through $75 levels, which markets a previously established support level that was broken and now could likely be tested as resistance.
From the daily charts, we had previously noted that the low of $43.56 is essential to be broken to confirm a continuation in the downtrend. The daily charts however point to the fact that as price heads into the major support level, there is also a confluence with the falling trend line, which could yet again be tested for support, in this aspect, the eventual declines to $32 could take a while, a few months at the very least, depending on how the US Dollar moves in its trajectory, given the fact that the Dollar Index has retreated from its yearly highs and a psychological resistance level at 100. Today’s FOMC meeting could potentially set the stage for future course of action in Crude oil prices.
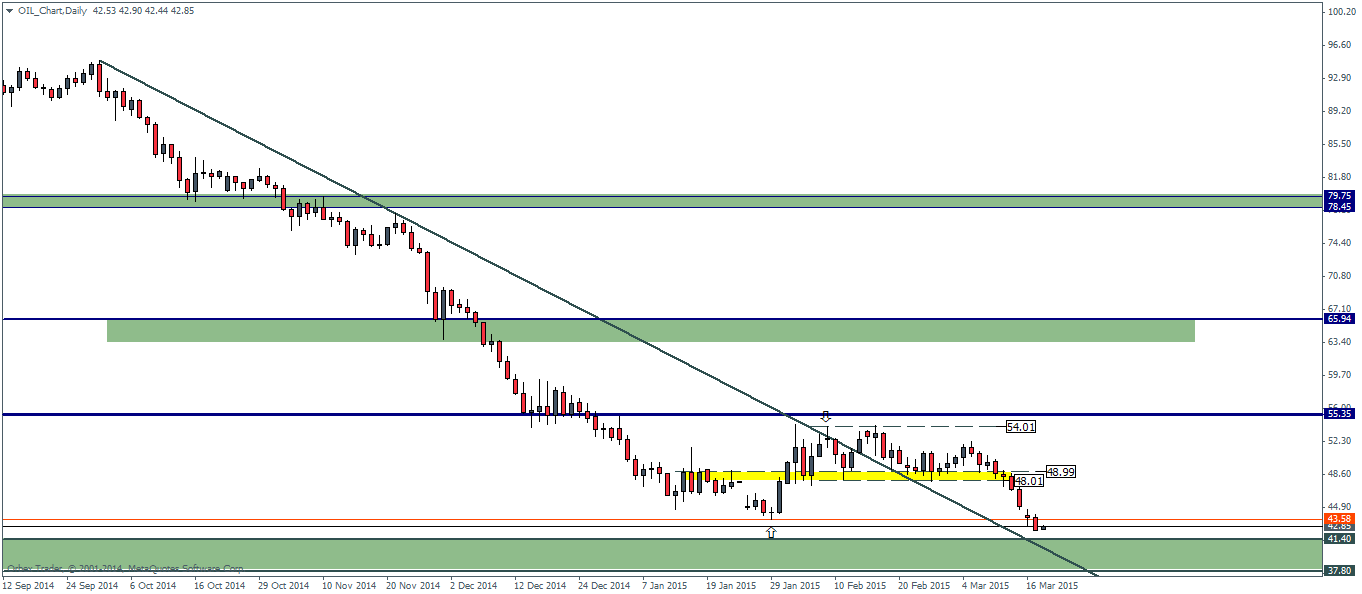
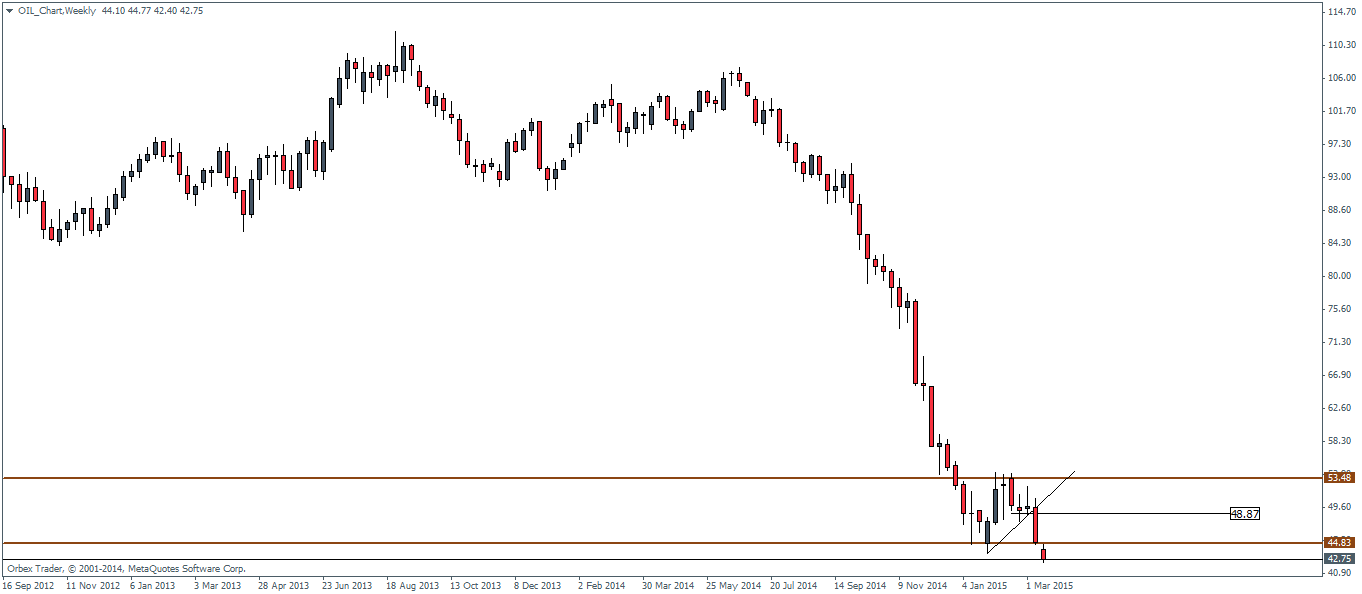
In the very short term, we could expect to see a minor rebound to 45.06, where, an unfilled gap sits at quite close to the previously established low before the decline in prices resume. The weekly or daily charts do not quite offer any clear evidence in terms of the candlestick patterns, but we do note that the weekly charts had formed a shooting star kind of a pattern two weeks ago that was validated by the bearish close last week, which is indicative of a continued momentum to the downside. Any upside bounces are likely to hold off near $48.87, which marks the break out from the short term trend line and the bounce could potentially be seen as a retest of the trend line break out as shown in the chart below.

![Credit Card 160×600 [EN]](https://assets.iorbex.com/blog/wp-content/uploads/2023/06/13144507/Blog-Banner_EN-Banner_160X600X2.webp)