
Crude Oil hits the monthly chart’s triangle price objective of $62.45
It might seem a bit redundant that we continue to show the same monthly chart of Crude Oil in most of the weekly crude oil analysis. After close to three months of monitoring the Crude Oil prices, earlier this week, price reached down to hit the $62.45 price target of the symmetrical triangle, making a new low of 60.58. Despite a wobbly US Dollar Index, which managed to see rally in precious metals such as Gold , Crude oil futures were little interested in the Greenback as it continued to dip lower and lower.
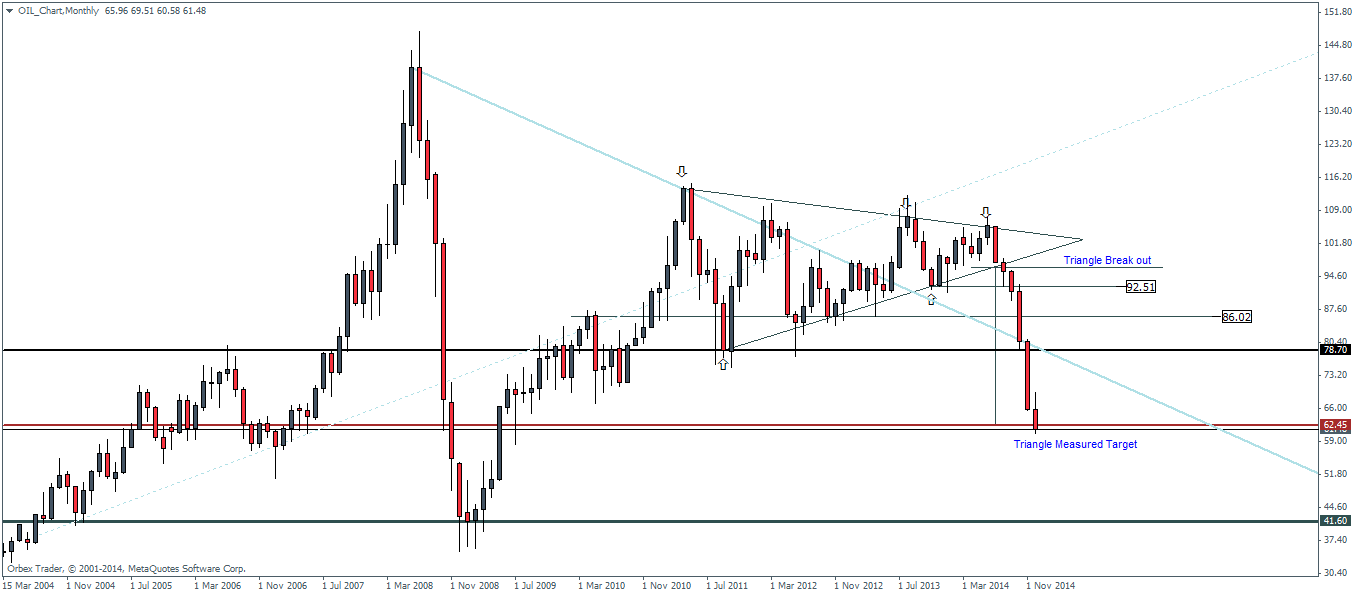
There weren’t much of any new catalysts to the Crude oil since last week, with the exception that Saudi Arabia continues to take the lead in determining the pricing in the markets. Last week, we heard news that Saudi Arabia cut oil prices for January delivery for its customers in the US and Asia. According to the reports, most main stream analysts now expect to see Crude Oil drop to $55 a barrel in the coming months. The question that is on every trader’s mind is: Will Crude oil continue to push lower without any decent retracement?

Looking to the H4 Charts, we notice a fairly decent falling wedge pattern that has been forming since late November. If we were to go by purely technical trading, then a potential break out to the upside from this falling wedge could possibly see a rally back to the levels of $73, which is a level that often comes to mind regardless of how you view the charts.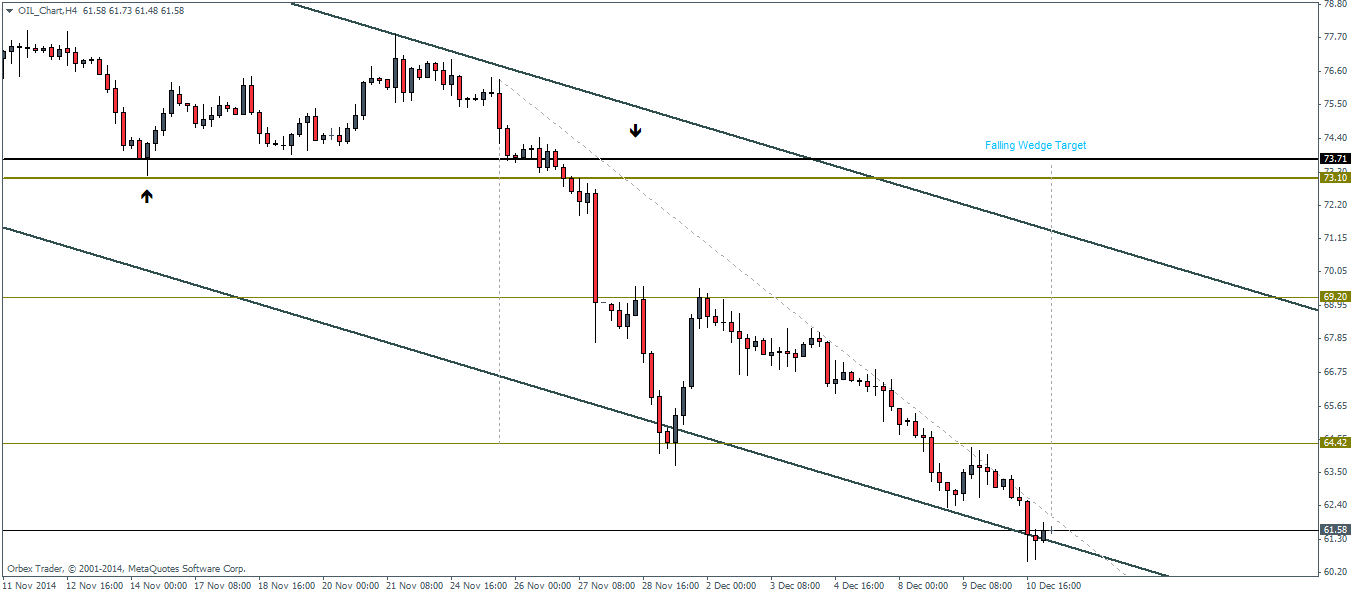
Given the current market conditions, it seems unlikely that Crude Oil prices could start to climb up back to the $73 levels and in this view it is quite likely that the ascent to retrace the $73 levels could a very gradual one at that, unless the geo politics change the dynamics so much that we get to see Crude prices rally quickly back to test the broken support for resistance.
We will need to see a break of at least 64.45 levels and a potential retest as a confirmation of support before we can assume that the retracement has started. Further to the upside, another minor level to watch out for is $69.20 levels which could also possibly act as resistance and the eventual rally towards $73.1 – $73.71 levels.
Yesterday’s US Crude Oil inventory report showed that stockpiles in the US increased last week as output in domestic shale oil production continues to rise. The EIA estimates that domestic production in the US could reach 9.32 million barrels per day by next year. OPEC meanwhile issued its monthly statement and was dovish in its views as it expects to see demand decline to 28.9 million barrels per day, down from 30.09 million during the current year.
Given the bearish outlook for Crude Oil, it will be very interesting to see how price will manage to retrace back higher.

![Credit Card 160×600 [EN]](https://assets.iorbex.com/blog/wp-content/uploads/2023/06/13144507/Blog-Banner_EN-Banner_160X600X2.webp)