Crude Oil heading into next week’s key OPEC Meeting
Yesterday, the US senate defeated the bill to approve the Keystone Pipeline XL project to bring Canadian oil sands crude oil to the US. The bill was defeated by one vote and is now pushed into 2015 where the outcome might be different. The Canadian Dollar was impacted by the news as it would have been a boost to the Canadian economy. However, questions remain as to the effectiveness of the pipeline project as the cost of producing crude oil from the oil sands is more expensive, especially at a time when international crude oil prices continue to fall.
The OPEC will be meeting in Vienna next week and it is widely expected that the outcome of the event will not see any significant shift in regards to oil production or try to rein in the falling crude oil prices. Countries such as Russian, Venezuela and Iran continue to be hit by the falling prices.
Despite the Greenback pausing in its rally, it did little to boost the WTI Crude oil prices.

Crude Oil Technical Analysis
Crude Oil prices declined since our last update from last week failing to capitalize on the bullish flag that was formed on the intra-day charts. Prices failed to break above the resistance at 75.97, managing to only brief spike above this level and eventually broke lower. The move was also validated as 75.97 formed the lower support of the alternate price channel, which is now the point of focus. The next major support for Crude Oil prices comes in at 73.33
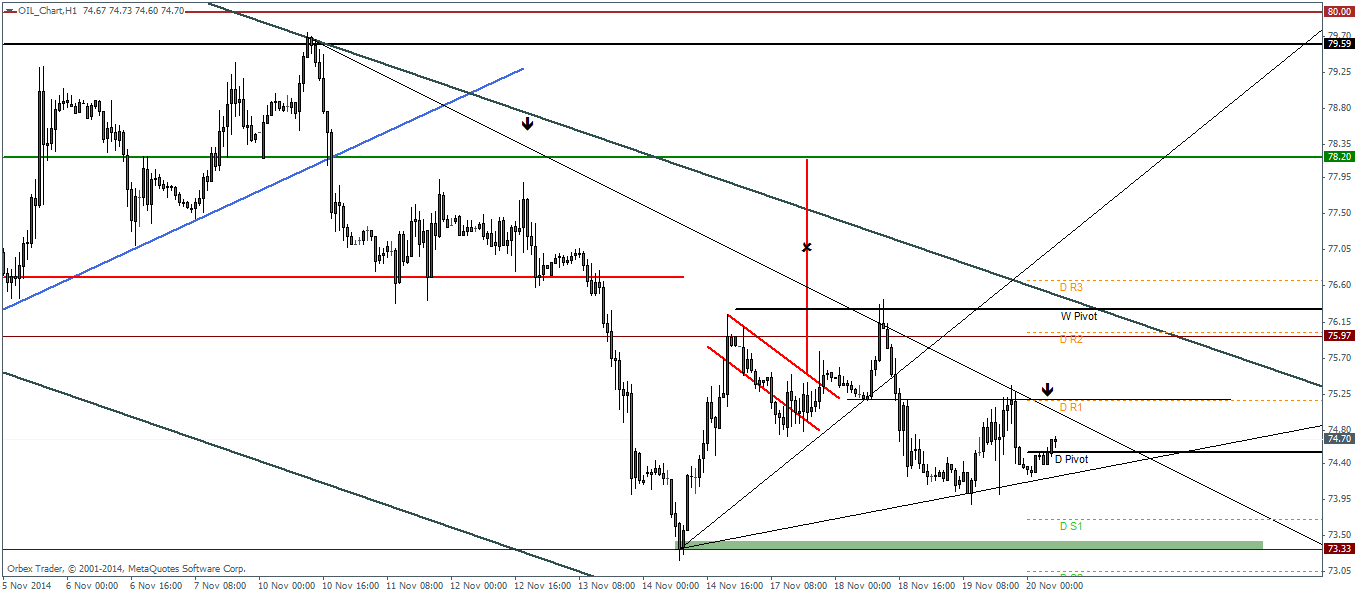
The short term downward sloping trend line, which has managed to cap rallies in the past could potentially come in as resistance for any short term moves to the upside for the moment. However, the support trend line, which is now close to today’s daily pivot level will have to be broken in order to expect declines to the major support at 73.33
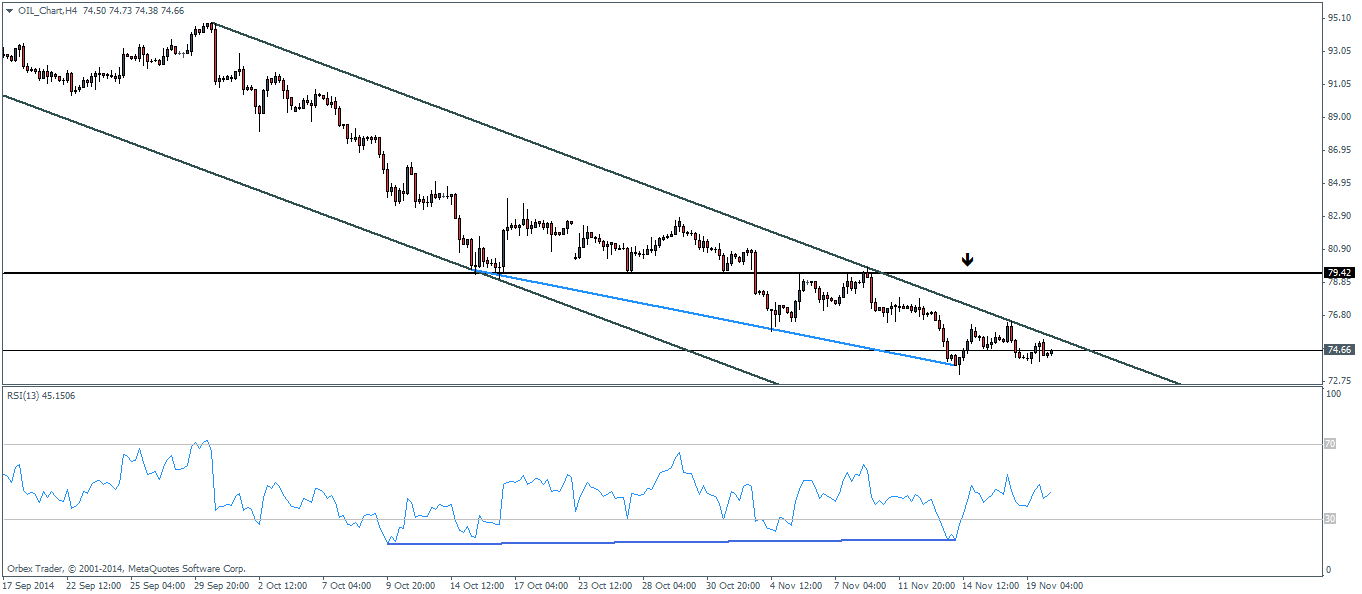
Looking to the H4 charts, the divergence to the RSI which we noted in the previous analysis continues to be in play as Crude made a new low near 737 handle but the RSI continuing to make a higher high. This is indicative of a potential rally back towards the major support at 79.42 levels to be tested for resistance before prices decline further.
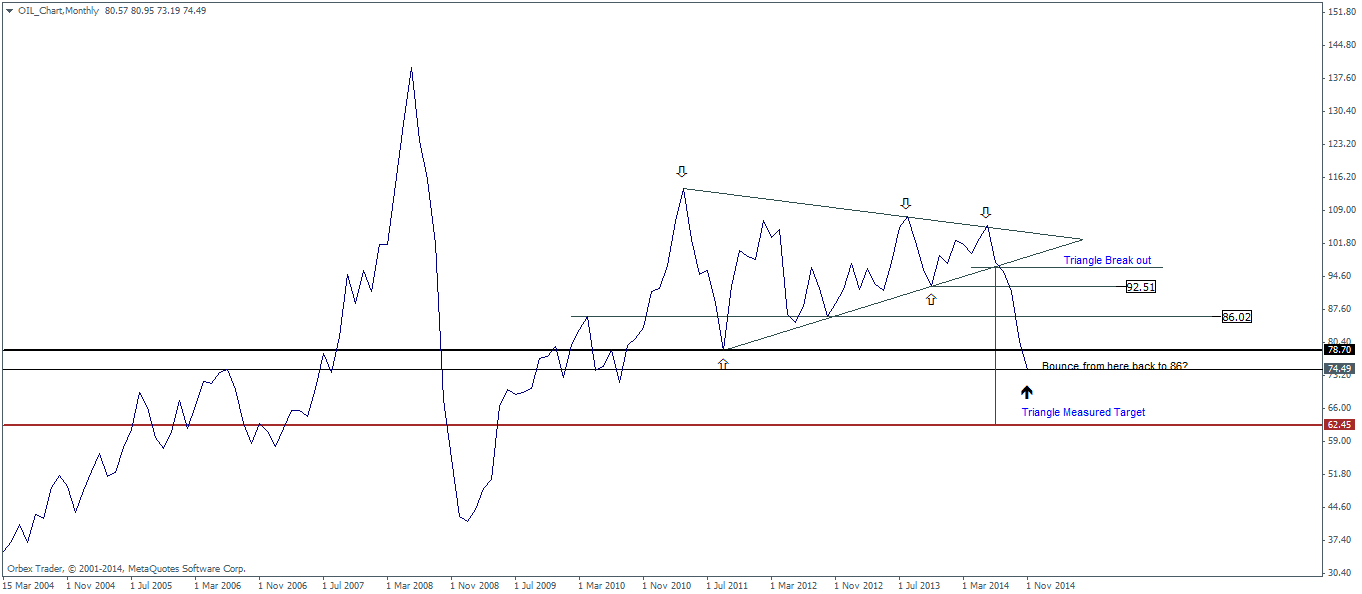
And finally, the Crude Oil monthly chart that we have been watching shows no respite to the declines with the weekly chart’s price action continuing to be extremely bearish. When looking to the daily charts however, we do see a bullish candle that was formed last Friday making an intra-day low to 73.19. A break below this pivotal low could set the stage for continued declines with no correction in sight. Alternatively, if prices hold above this level, we could expect to see a possible retracement in crude oil.
Crude Oil Pivot Levels
| R3 | R2 | R1 | Pivot | S1 | S2 | S3 | |
| Weekly | 86.05 | 82.95 | 79.47 | 76.37 | 72.89 | 69.79 | 66.31 |
| Daily | 76.7 | 76.04 | 75.18 | 74.52 | 73.66 | 73 | 72.14 |

![Credit Card 160×600 [EN]](https://assets.iorbex.com/blog/wp-content/uploads/2023/06/13144507/Blog-Banner_EN-Banner_160X600X2.webp)