
NZDJPY: The Kiwi posted an all time high above 94 in early 2014 and since then has been in a gradual decline. While the currency initially fell rapidly in the early part of this year to form a short term base at 85.37, the bounce from here was short lived as the Kiwi formed a lower high near 92 and eventually broke the previous support near 85.37. In the compressed view, NZDJPY has formed a somewhat head and shoulders pattern, although in terms of time duration, the left shoulder clearly took a long time to form than compared to the head and the right shoulder.

The neckline for NZDJPY comes in at 84.88 while the H&S points to a downside minimum objective of 79.138 or 79.2 rounded off.
Comparing the price action to the RSI, we notice that the current lows near 81.14 support does not confirm with the RSI’s lows and thus signals a potential bullish divergence pattern being set up. We notice a confluence of the bullish divergence here, which points to a test of previously broken support at 84.88 (neckline) as a possible price zone that price could test for resistance.

Given the bearish view in the NZD currency in general and the dovish take by the RBNZ, NZDJPY remains a sell, while 84.88 makes for a potential zone that could attract the sellers into the market which will see an eventual dip down to 79.20.
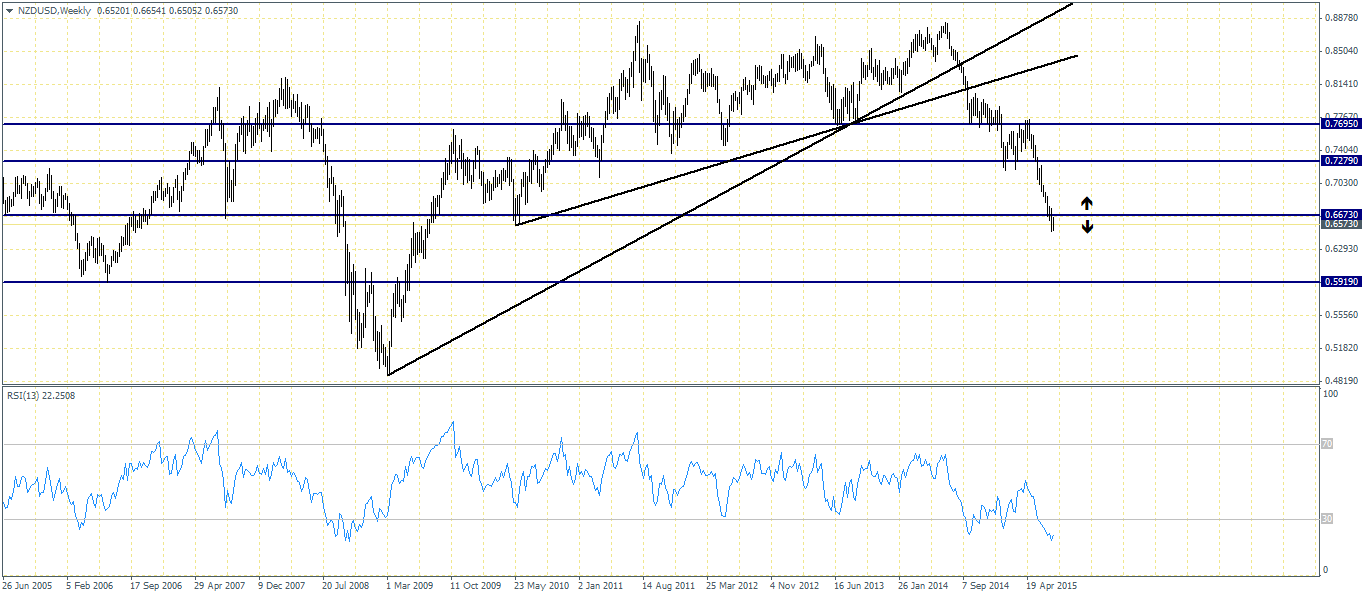
NZDUSD: The Kiwi has formed two clear levels of interest. First there is the broken support near 0.7279 and then there is the upper resistance that was previously serving as a support level near 0.7699. The rapid decline in prices prompts us to compare the price action to the RSI from the daily charts where we notice that the indicator is already forming a higher high (we need to however see a few bullish candles above 0.6665 in order to confirm this view). Comparing the current price to the past, the current lows below 0.66 coincides with the previous lows off March 2010. Thus, in order to anticipate further moves, NZDUSD will need to test 0.6673. A break above 0.6673 will see NZDUSD potentially turn bullish in the medium term with an eye on recovering the losses to test back 0.7279 level of broken support for resistance. Alternatively, if 0.6673 holds as resistance, NZDUSD will likely decline in the medium term to 0.5919 support.
EURNZD: The Euro managed to remain strong despite the months of turmoil and uncertainty on account of the Greece debt crisis. The Single currency staged a strong rally against the Kiwi despite the fundamental risks. However, price action has pretty much stalled since late June with EURZND trading sideways within 1.6726 and 1.6366. These levels are quite straight forward as a break out in either direction will signal a renewed momentum take shape that could either push prices higher or lows.
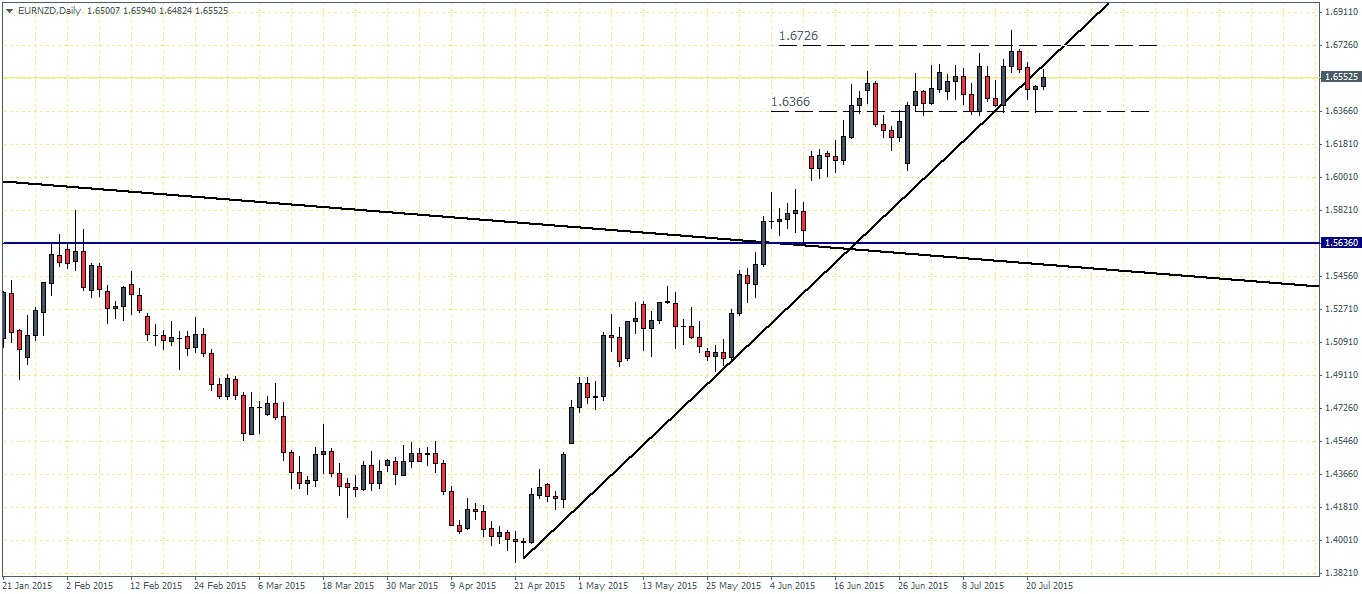
We remain biased to the downside on break of 1.6366 as a retest to 1.5636 is very likely. This break out level is off the weekly chart’s trend line which hasn’t seen any credible retest and thus remains a potential target should sellers overwhelm the market. However, in the unlikely event that prices fail to break lower, a potential upside breakout above 1.6366 will likely see EURNZD stay on course to test the next major support at 1.7178 from the weekly charts.

