
Crude Oil back to trading below $50
Crude Oil futures remained pressured to the downside, with the commodity shedding close to -2.8% for the week as of Thursday, 23rd July trading near $49.33. The onset of the bearish price action in Crude Oil was largely in part due to the lifting of sanctions on Iran as the country reached an agreement with the international community to cooperate with the IAEA and to partially give up its enrichment of Uranium. With Iran’s Oil now poised to hit the global markets and especially making it easier for countries in the East, such as China and India, it was expected for Crude Oil to be hit by a continued supply glut combined with a stronger US Dollar as expectations for a US Fed rate hike keeps up the bullish momentum and thus sending Crude Oil prices lower.
Trading below the $50 psychological price level, Crude Oil was previously trading at these levels in early April. In its weekly report, the US Energy Information Administration reported that the US stockpiles increased 2.5 million barrels. Analysts expected that the US stockpiles would be down 2.3 million.
Imports from Saudi Arabia increased to 1.44 million barrels per day, up from 1.32 million barrels recorded for the week before. The US also increased its imports from other non-OPEC countries as well, according to the EIA Crude Oil report.

Crude Oil Technical Analysis
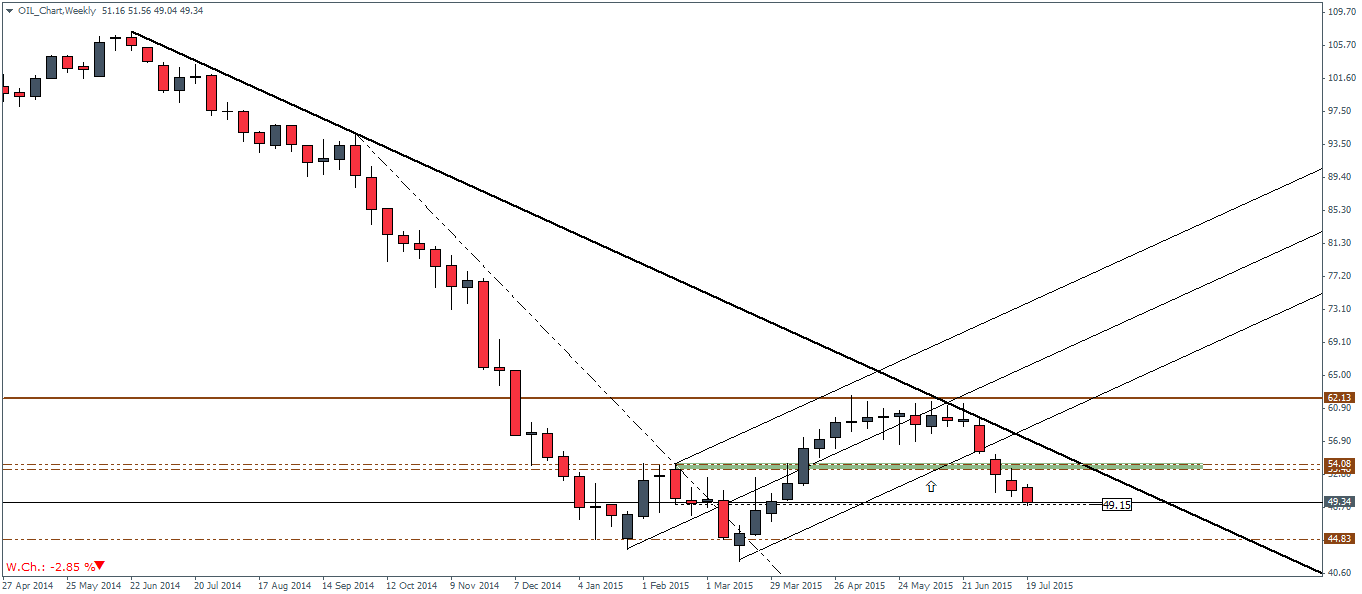
Starting with the weekly charts, Crude Oil broke through the lower median line and fell through the support at 54 – 52 without a hitch. The continued bearish momentum saw prices clear this level of support and prices are now trading near $49.15 level of support. In the short term, we could expect some bounce back to the previously broken support near 54 – 52. If resistance is established here, Crude Oil could then turn very bearish attempting to take out the previous lows formed below 44.8.
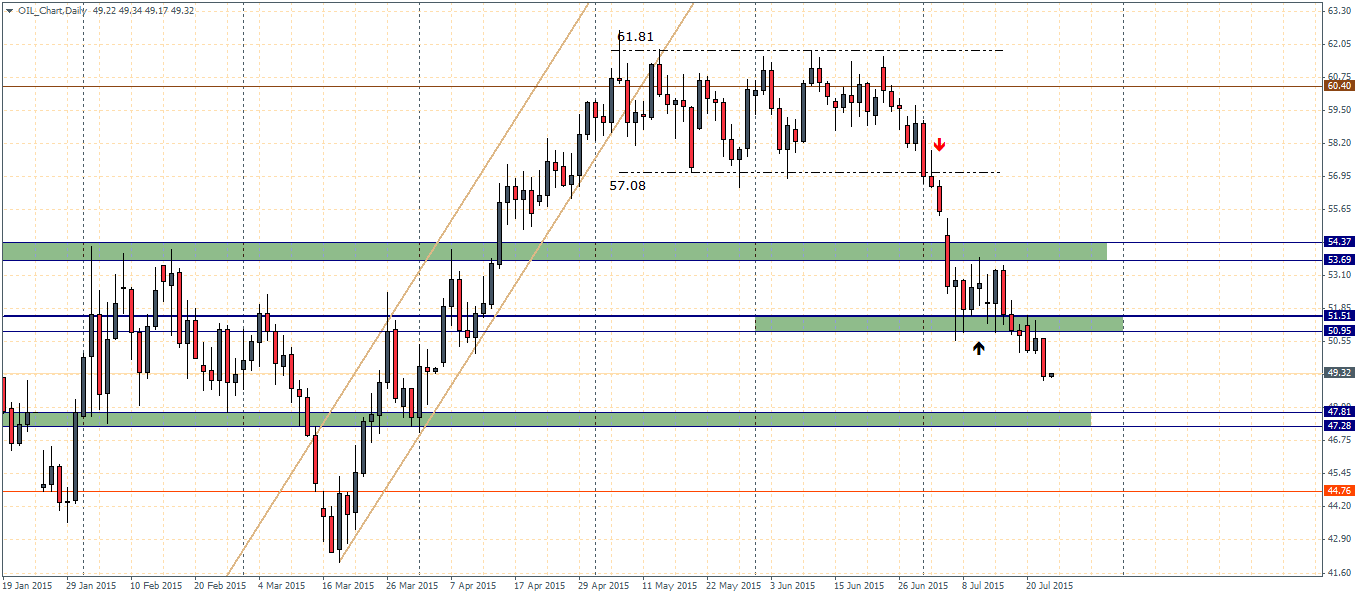
Switching to the daily charts, Crude oil found no clear support near the 51 – 50 region and therefore we could expect the declines to continue lower to test the next support at 47.81 through 47.3. Of course, there could be a possibility for Crude Oil to retest the broken support for resistance at 51 – 50. Once prices test the lower support at 47 .81 – 47.3 it will be interesting to watch as the next support lower will come in at 44.76, which if fails to hold prices we could expect new lows being made in Crude Oil.
Supporting our view on the H4 charts, we notice a strong bullish divergence being formed currently as the RSI fails to confirm the current lows in prices. This points us to an upside correction in store towards $51.3, which when viewed from the daily chart, sits right within the previously broken support level. As such, it is very possible for Crude Oil to retrace some of its recent declines while the price zone of $51.3 is likely to attract new sellers into the market.


![Credit Card 160×600 [EN]](https://assets.iorbex.com/blog/wp-content/uploads/2023/06/13144507/Blog-Banner_EN-Banner_160X600X2.webp)