
NAS 100 hits resistance
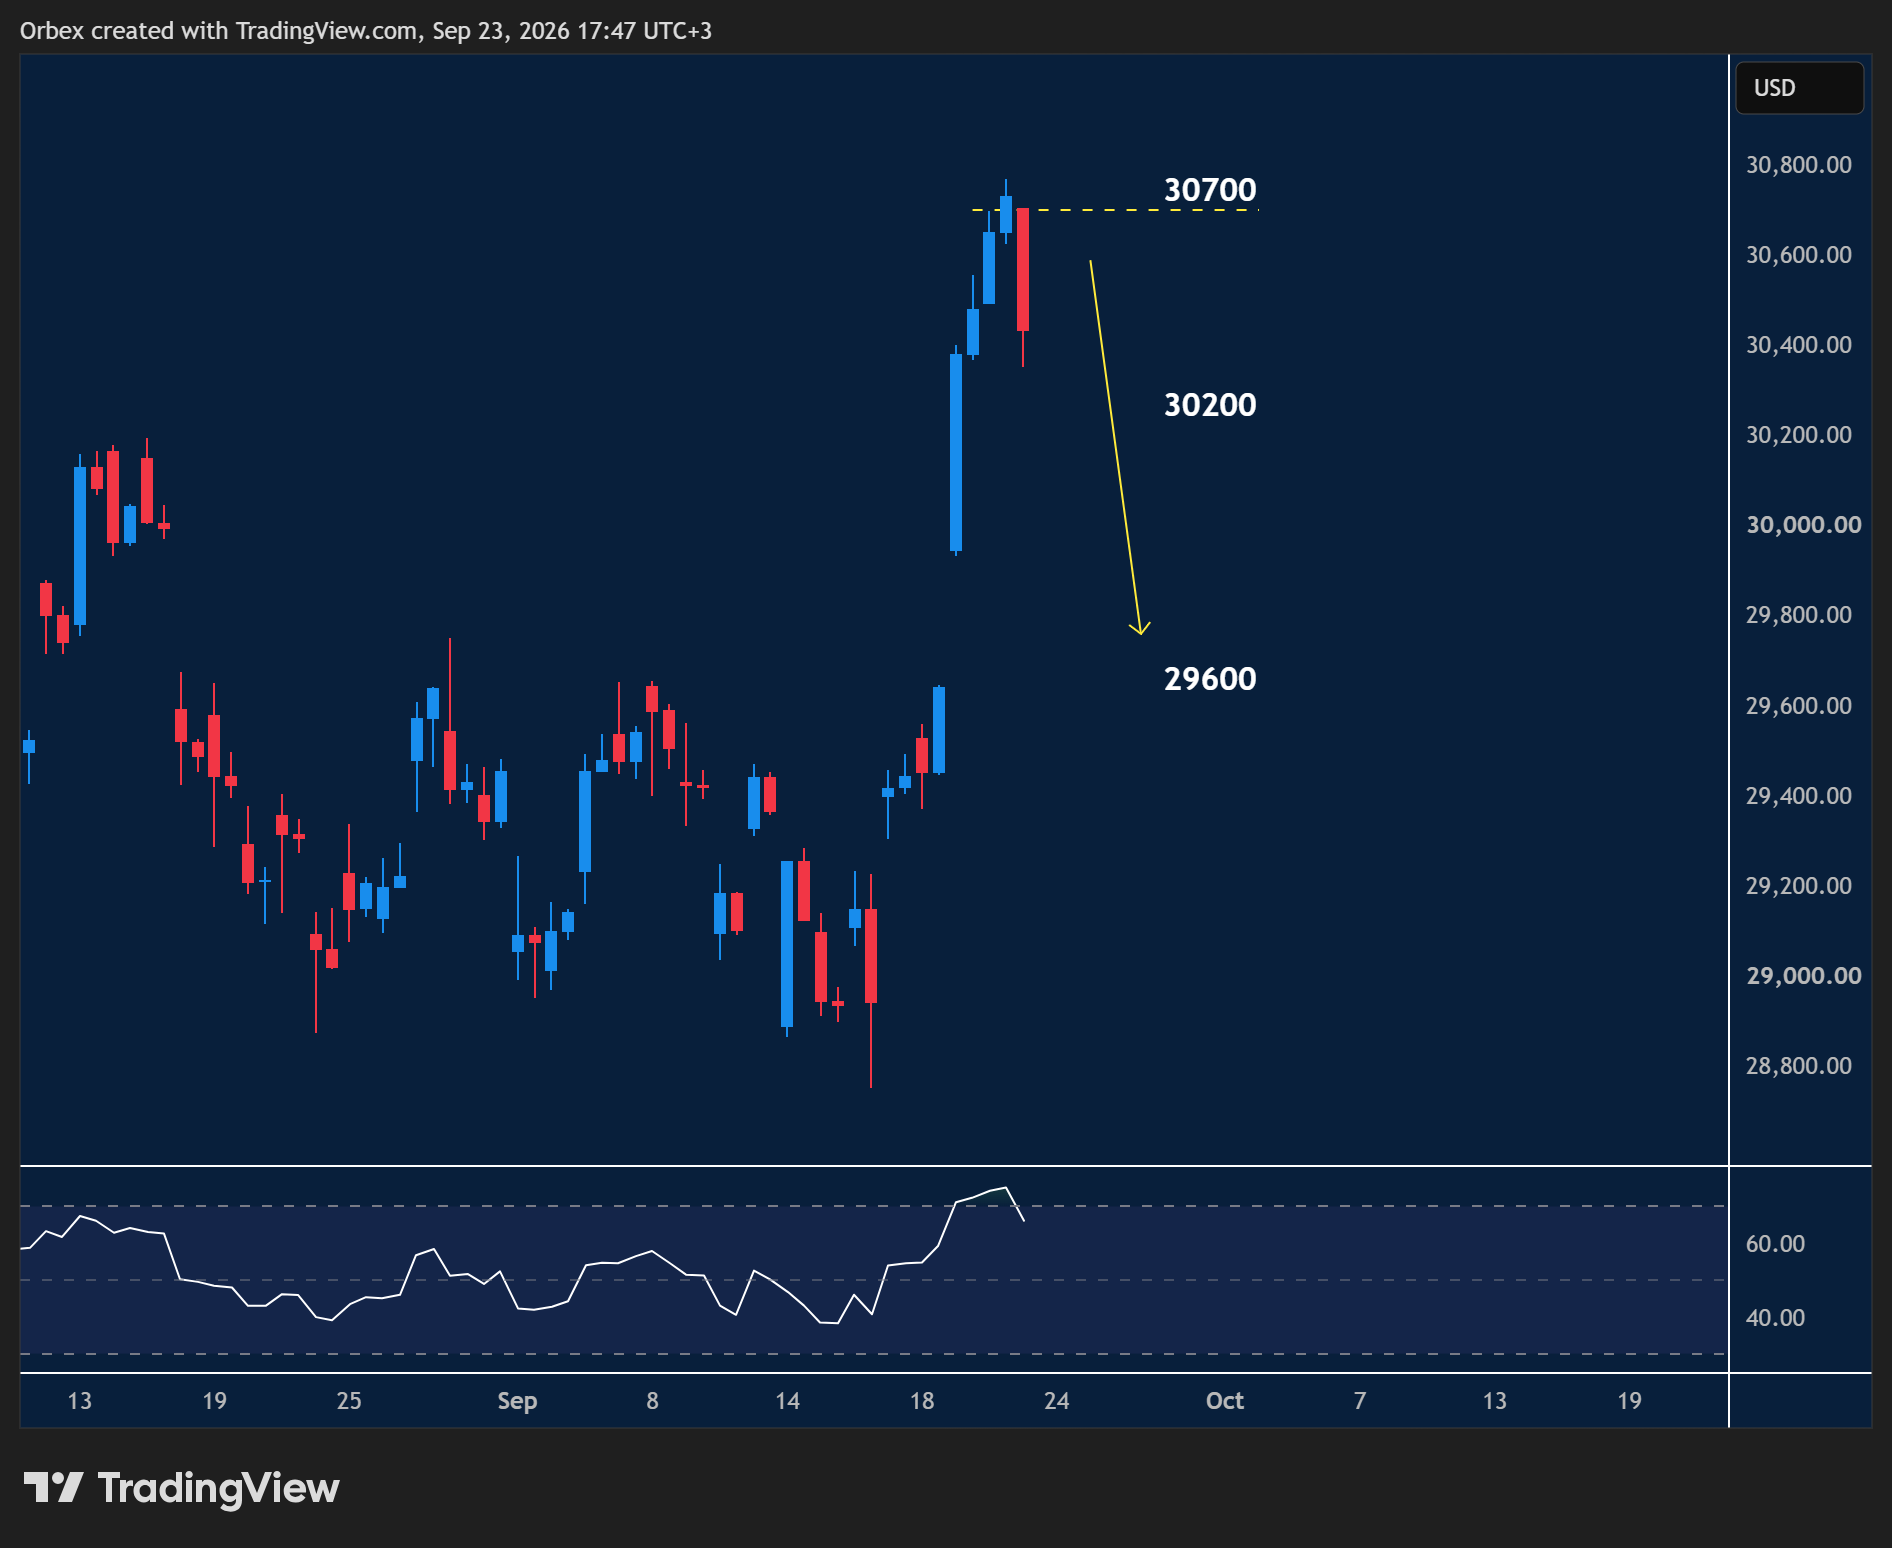
Indices took a step back as the Nasdaq failed to progress beyond the 30700 level.
- A move away from the said peak has given sellers the initiative to jump in, keeping the Nasdaq under pressure.
- The index now looks to the next psychological level of 30000 if 30200 is broken, putting further downside pressure on the Nasdaq.
- Further down, 29600 awaits the index if there is a deeper correction ahead.

GBPUSD collapses lower
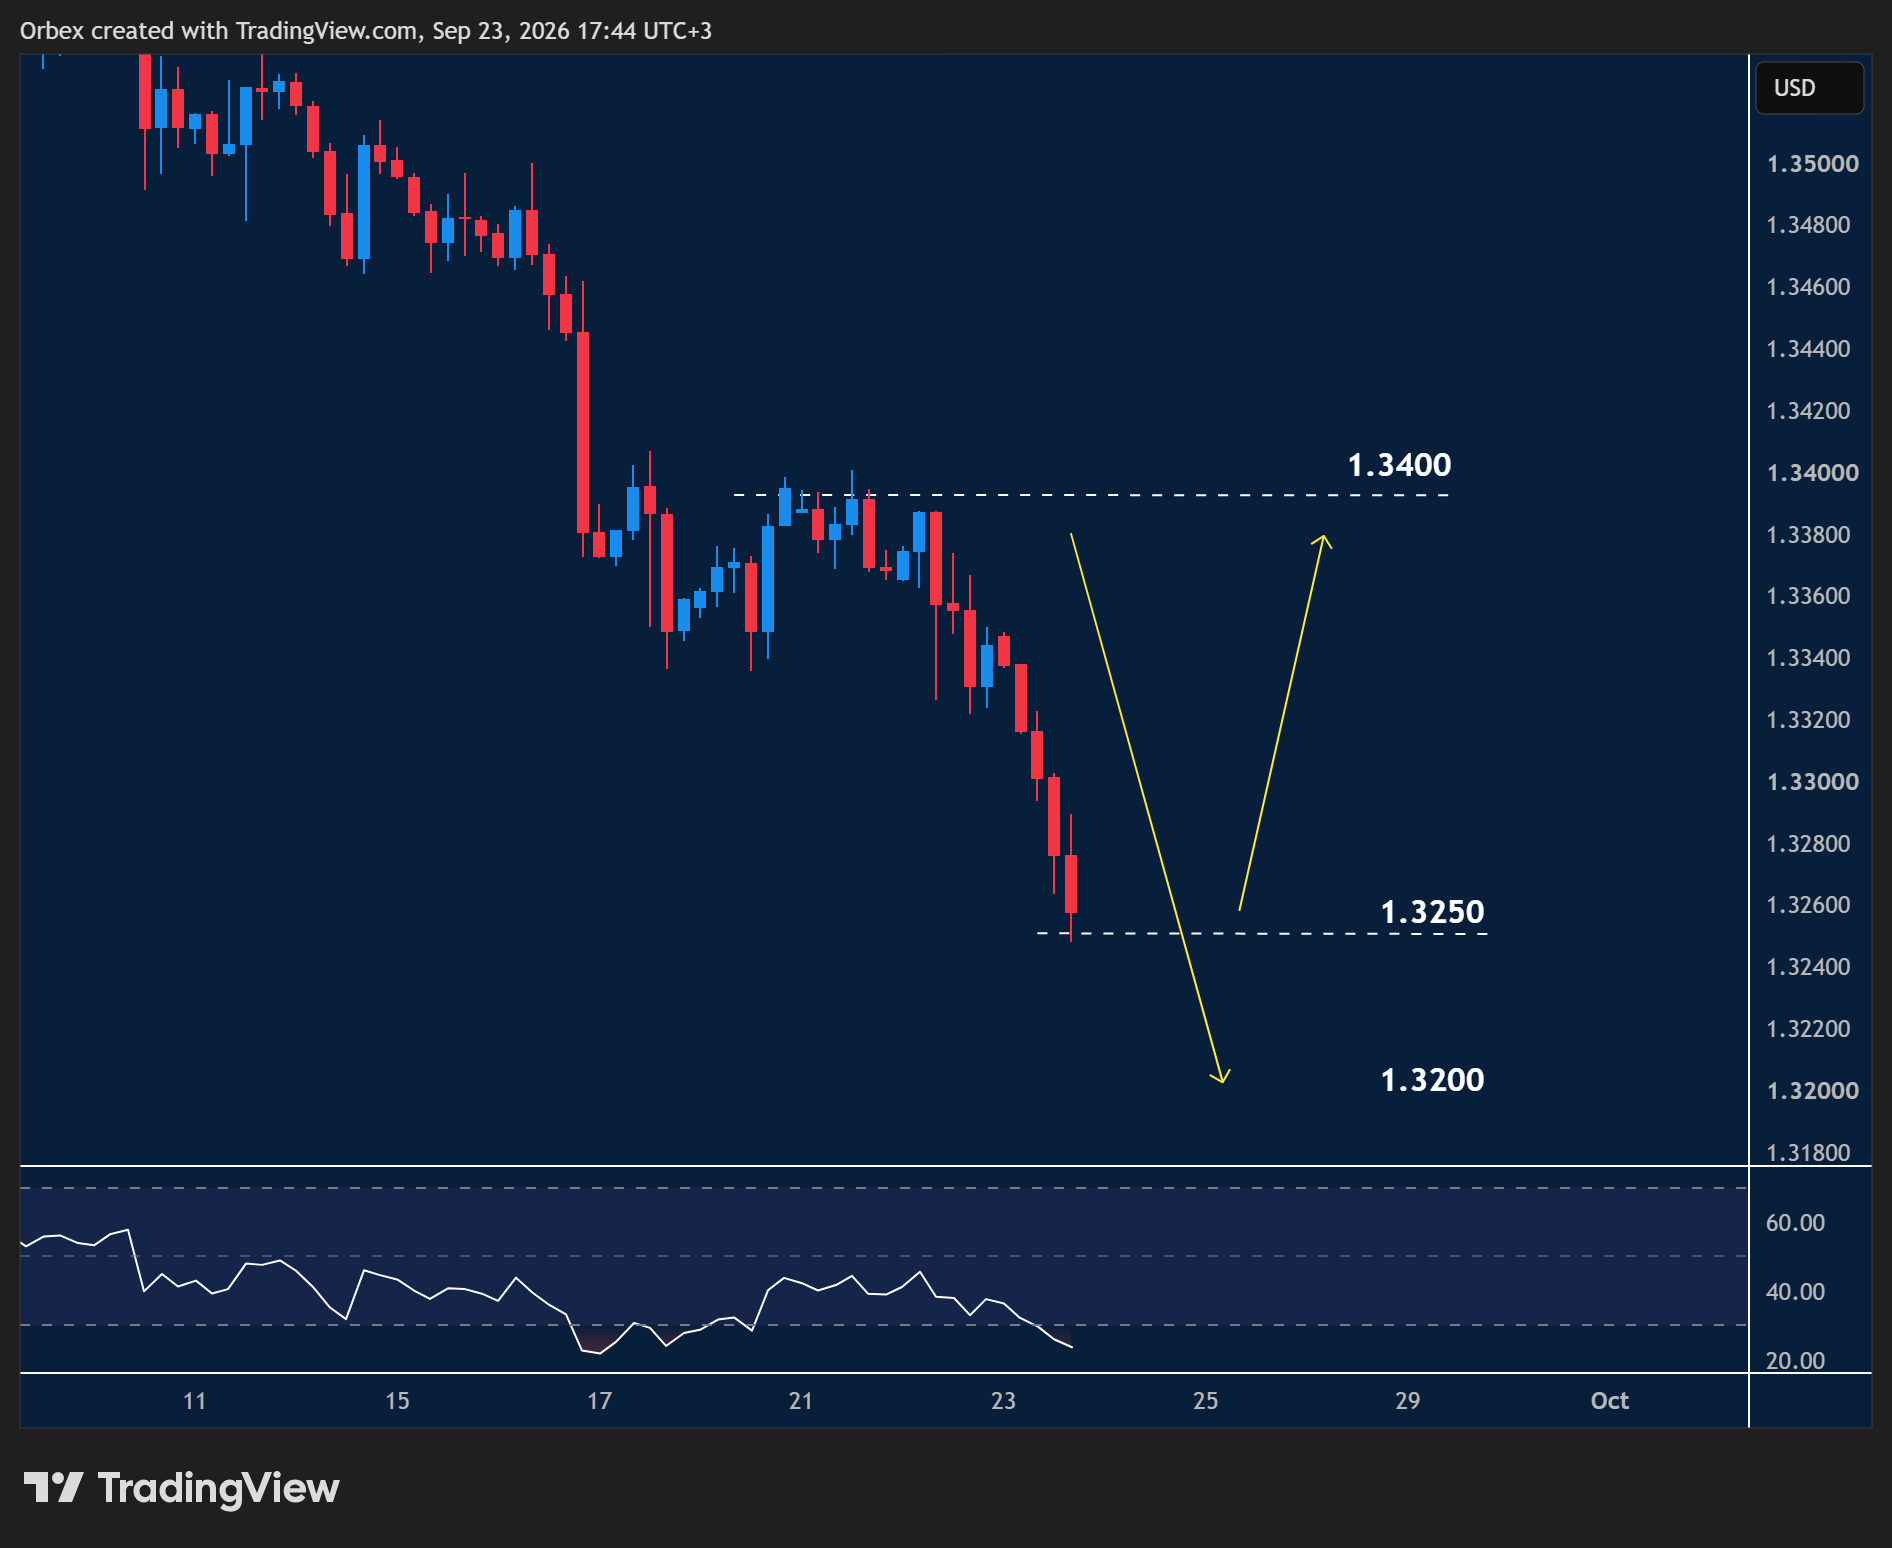
Cable turned lower after the dollar kept its momentum going from last week.
- The pair’s downturn below 1.3300 continued as trend followers look to sustain the rally.
- As the pair tests 1.3250, the RSI’s oversold status could attract dip-buyers.
- Unless 1.3250 is held, the sell-off could continue as the greenback looks to build momentum towards 1.3200.
- 1.3400 is the higher target if the pair finds support.
XAUUSD tests critical target
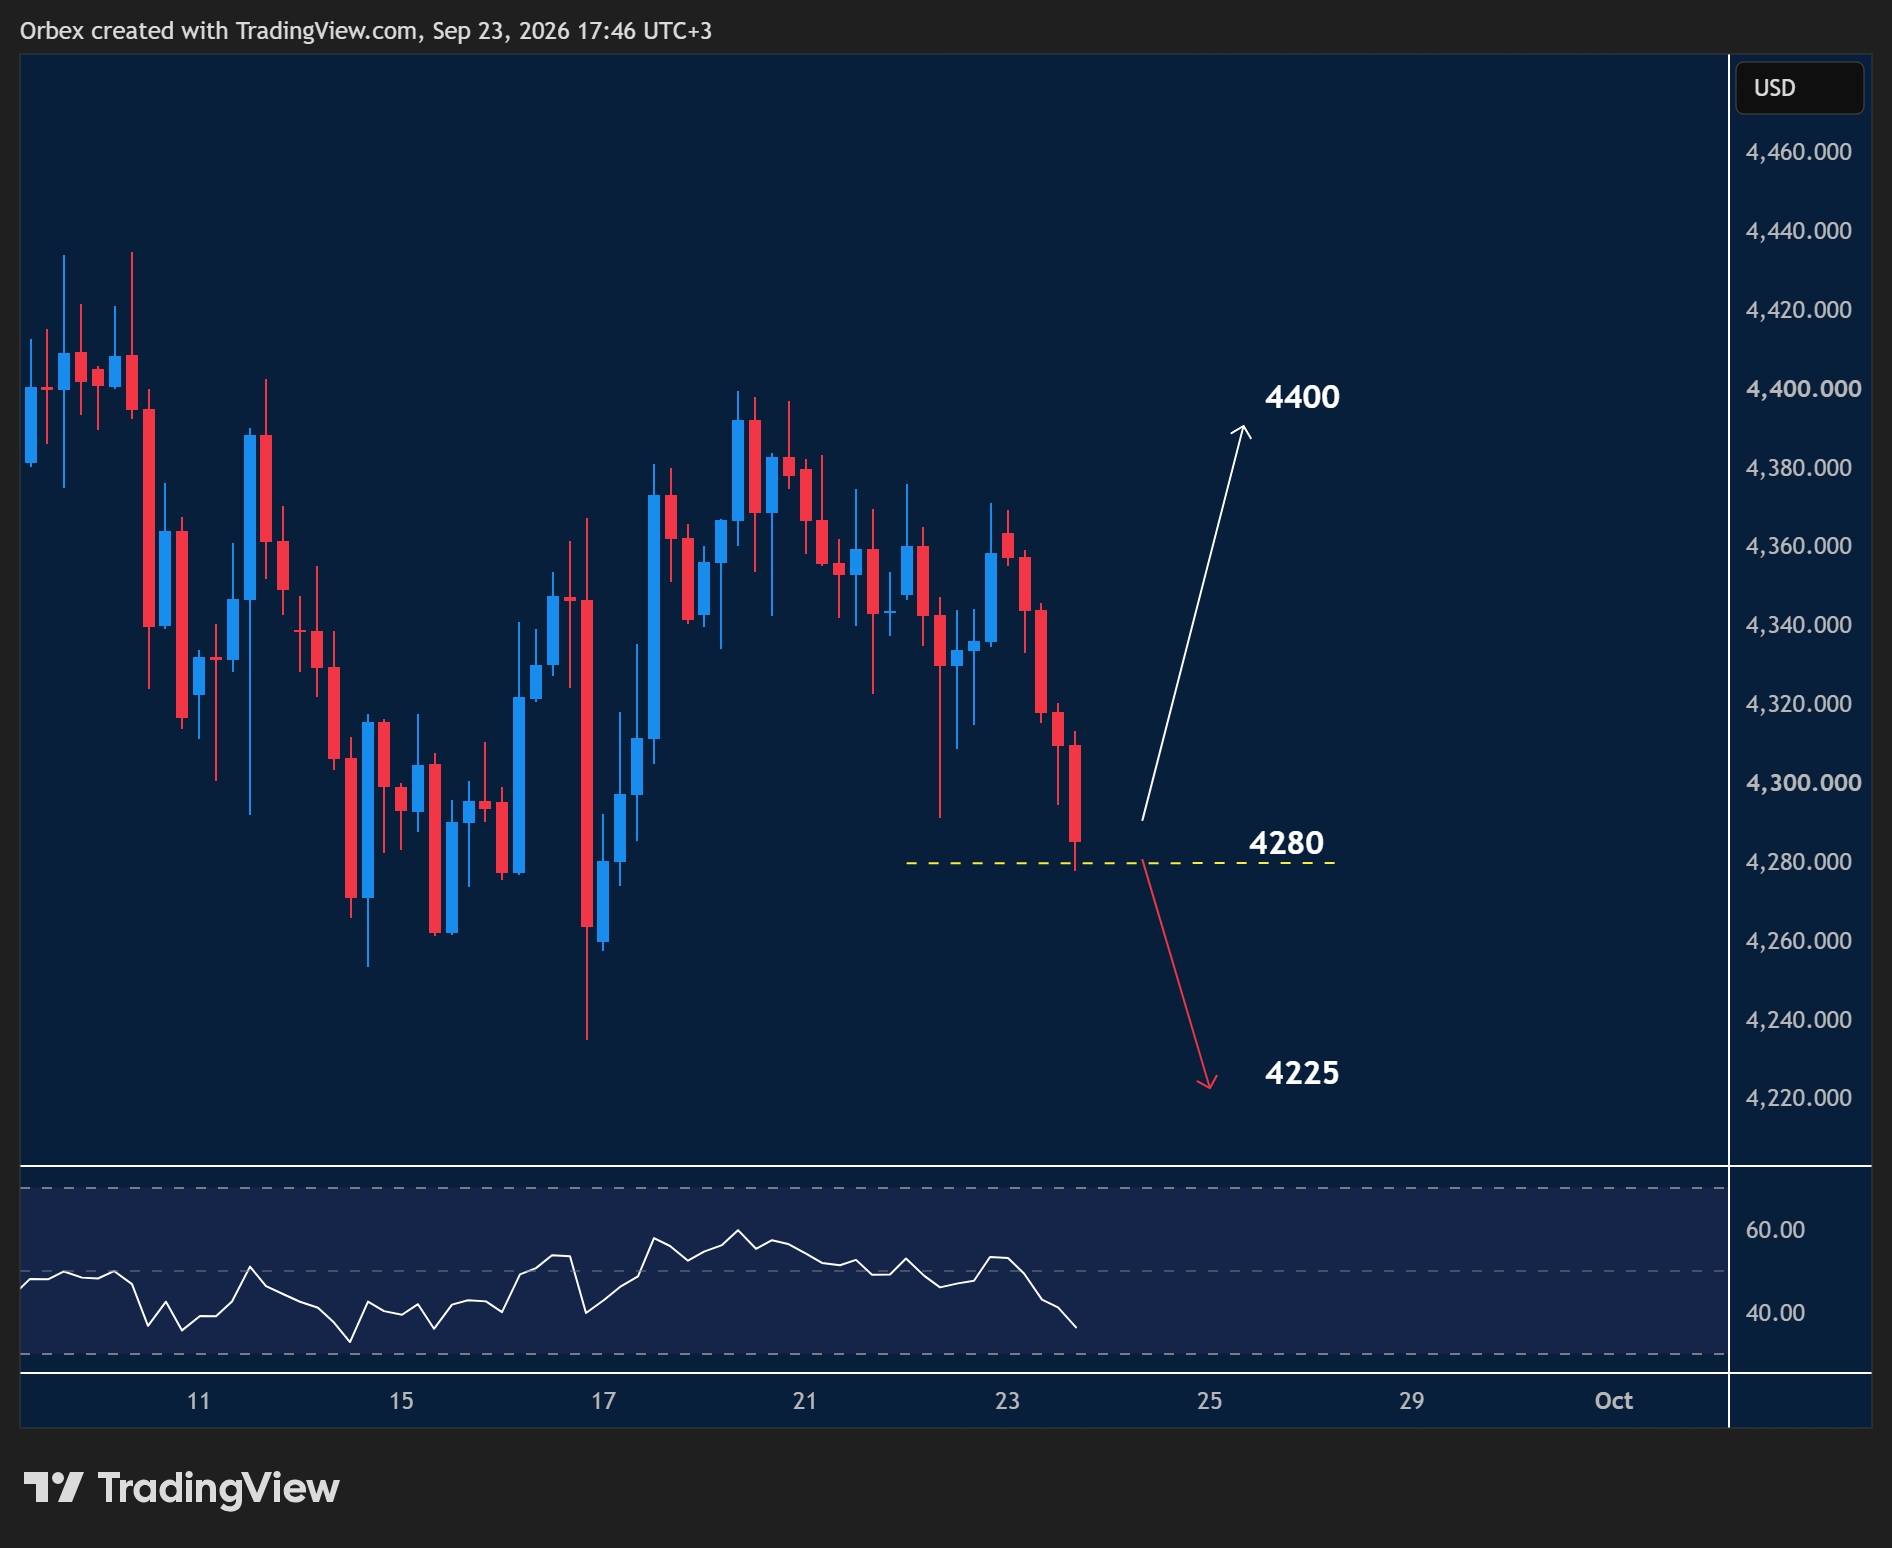
Gold continues its bearish stance as prices fell another $60.
- On the chart, the direction is slightly skewed as the precious metal looks to find a bounce.
- The price is testing the bottom of the recent rally at 4280.
- 4225 awaits the next bearish move as gold remains corrective.
- A bounce at 4280 would give buyers a fighting chance to de-escalate the trend for a move to 4400.
Trading the forex market requires extensive research, and that’s what we do best