
US 30 waiting for the next signal
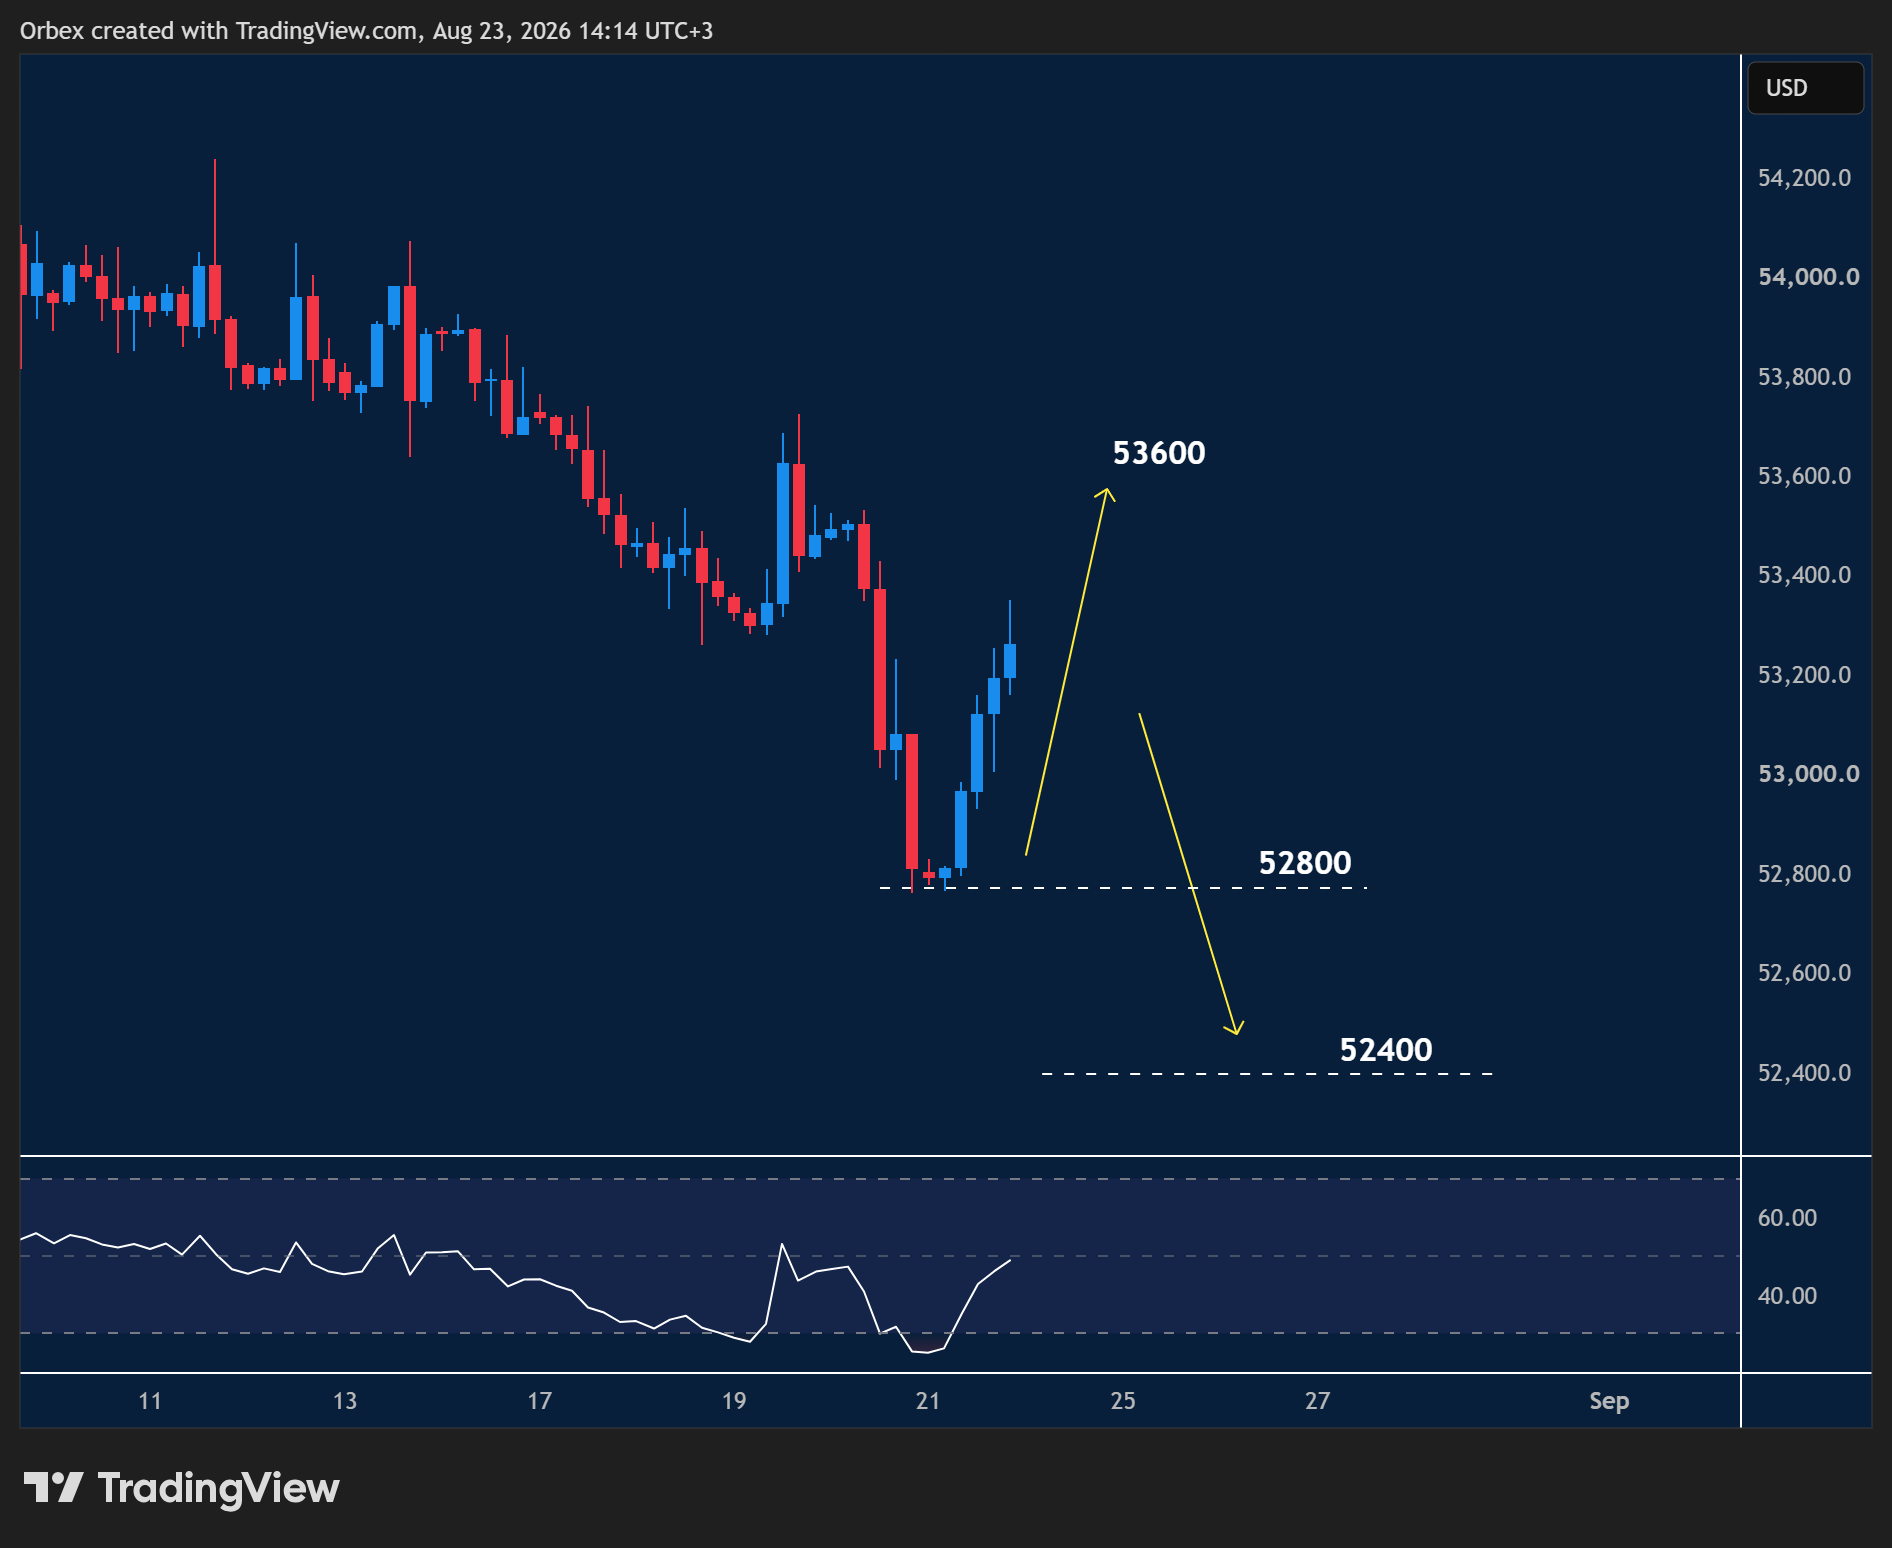
The Dow (US 30 ) jumped over 500 points in Friday’s session, but failed to lift the back-to-back weekly losses.
- The index is testing the previous swing high and daily resistance at 53400.
- A rejection at the said level would force bulls to abandon ship and could lead to a deeper correction.
- The top of a limited bounce at 53600 is the first hurdle to clear.
- In case of a bearish breakout, 52800 could be in the crosshairs, with 52400 the next target.

USDJPY fails to break resistance
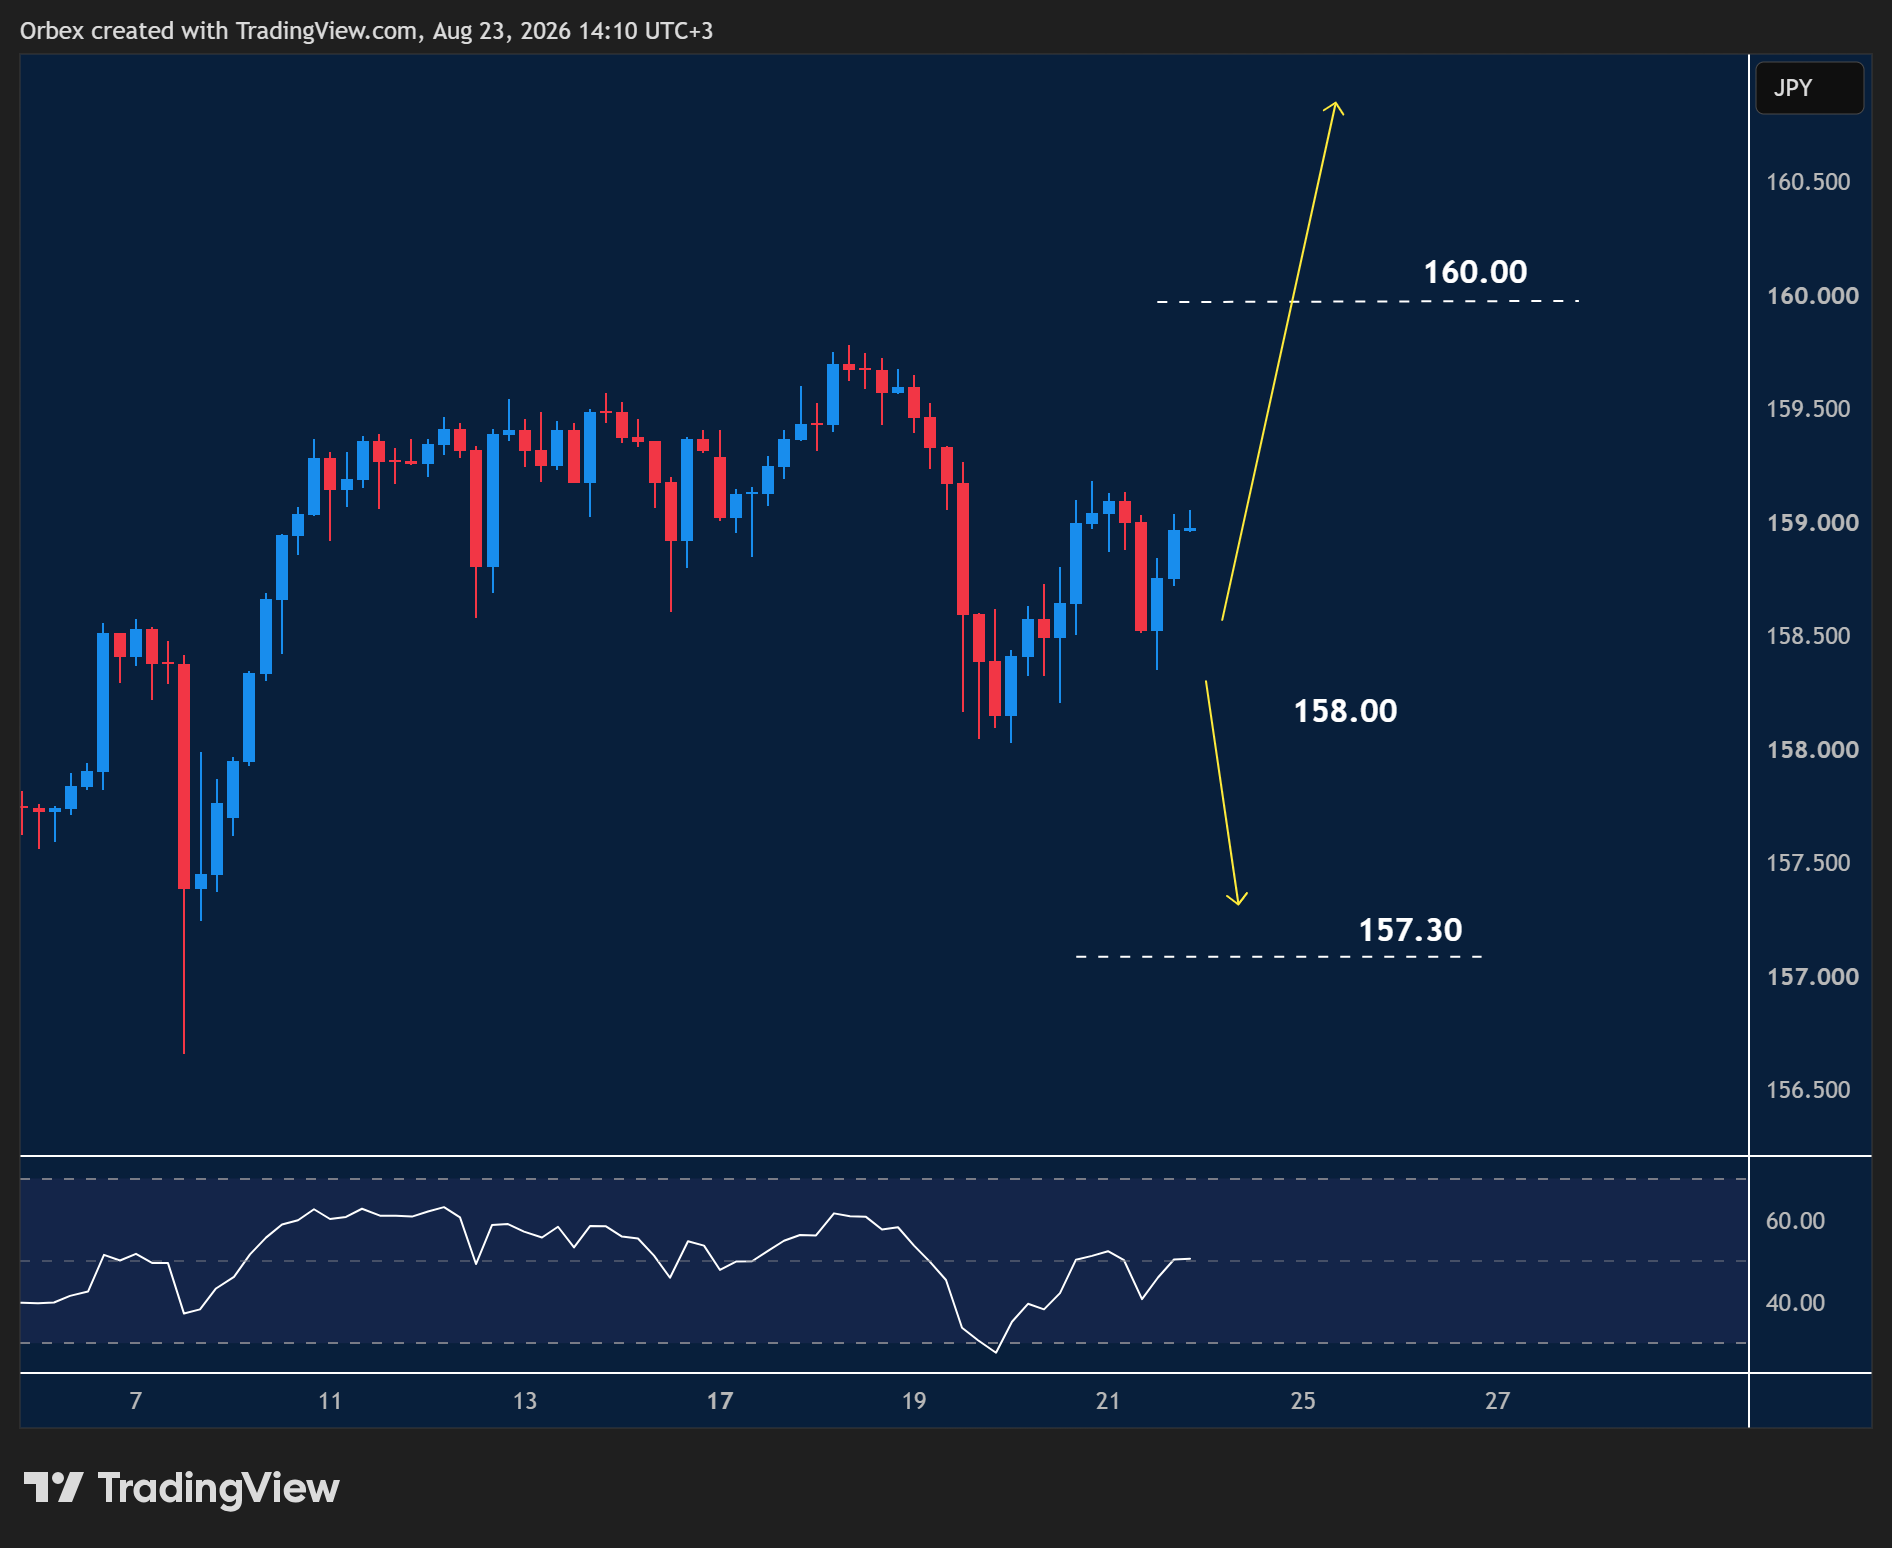
The Dollar fails to move higher as the pair remains undecided on its next move.
- Prices cut through the round number of 159.00, sending an upbeat signal.
- 160.00 is the next level to see if bulls will step in to keep prices elevated.
- The pair extend losses if the 158.00 support is broken.
- The RSI’s move towards the neutral zone could cause a pullback towards 157.30.
EURGBP maintains bear run
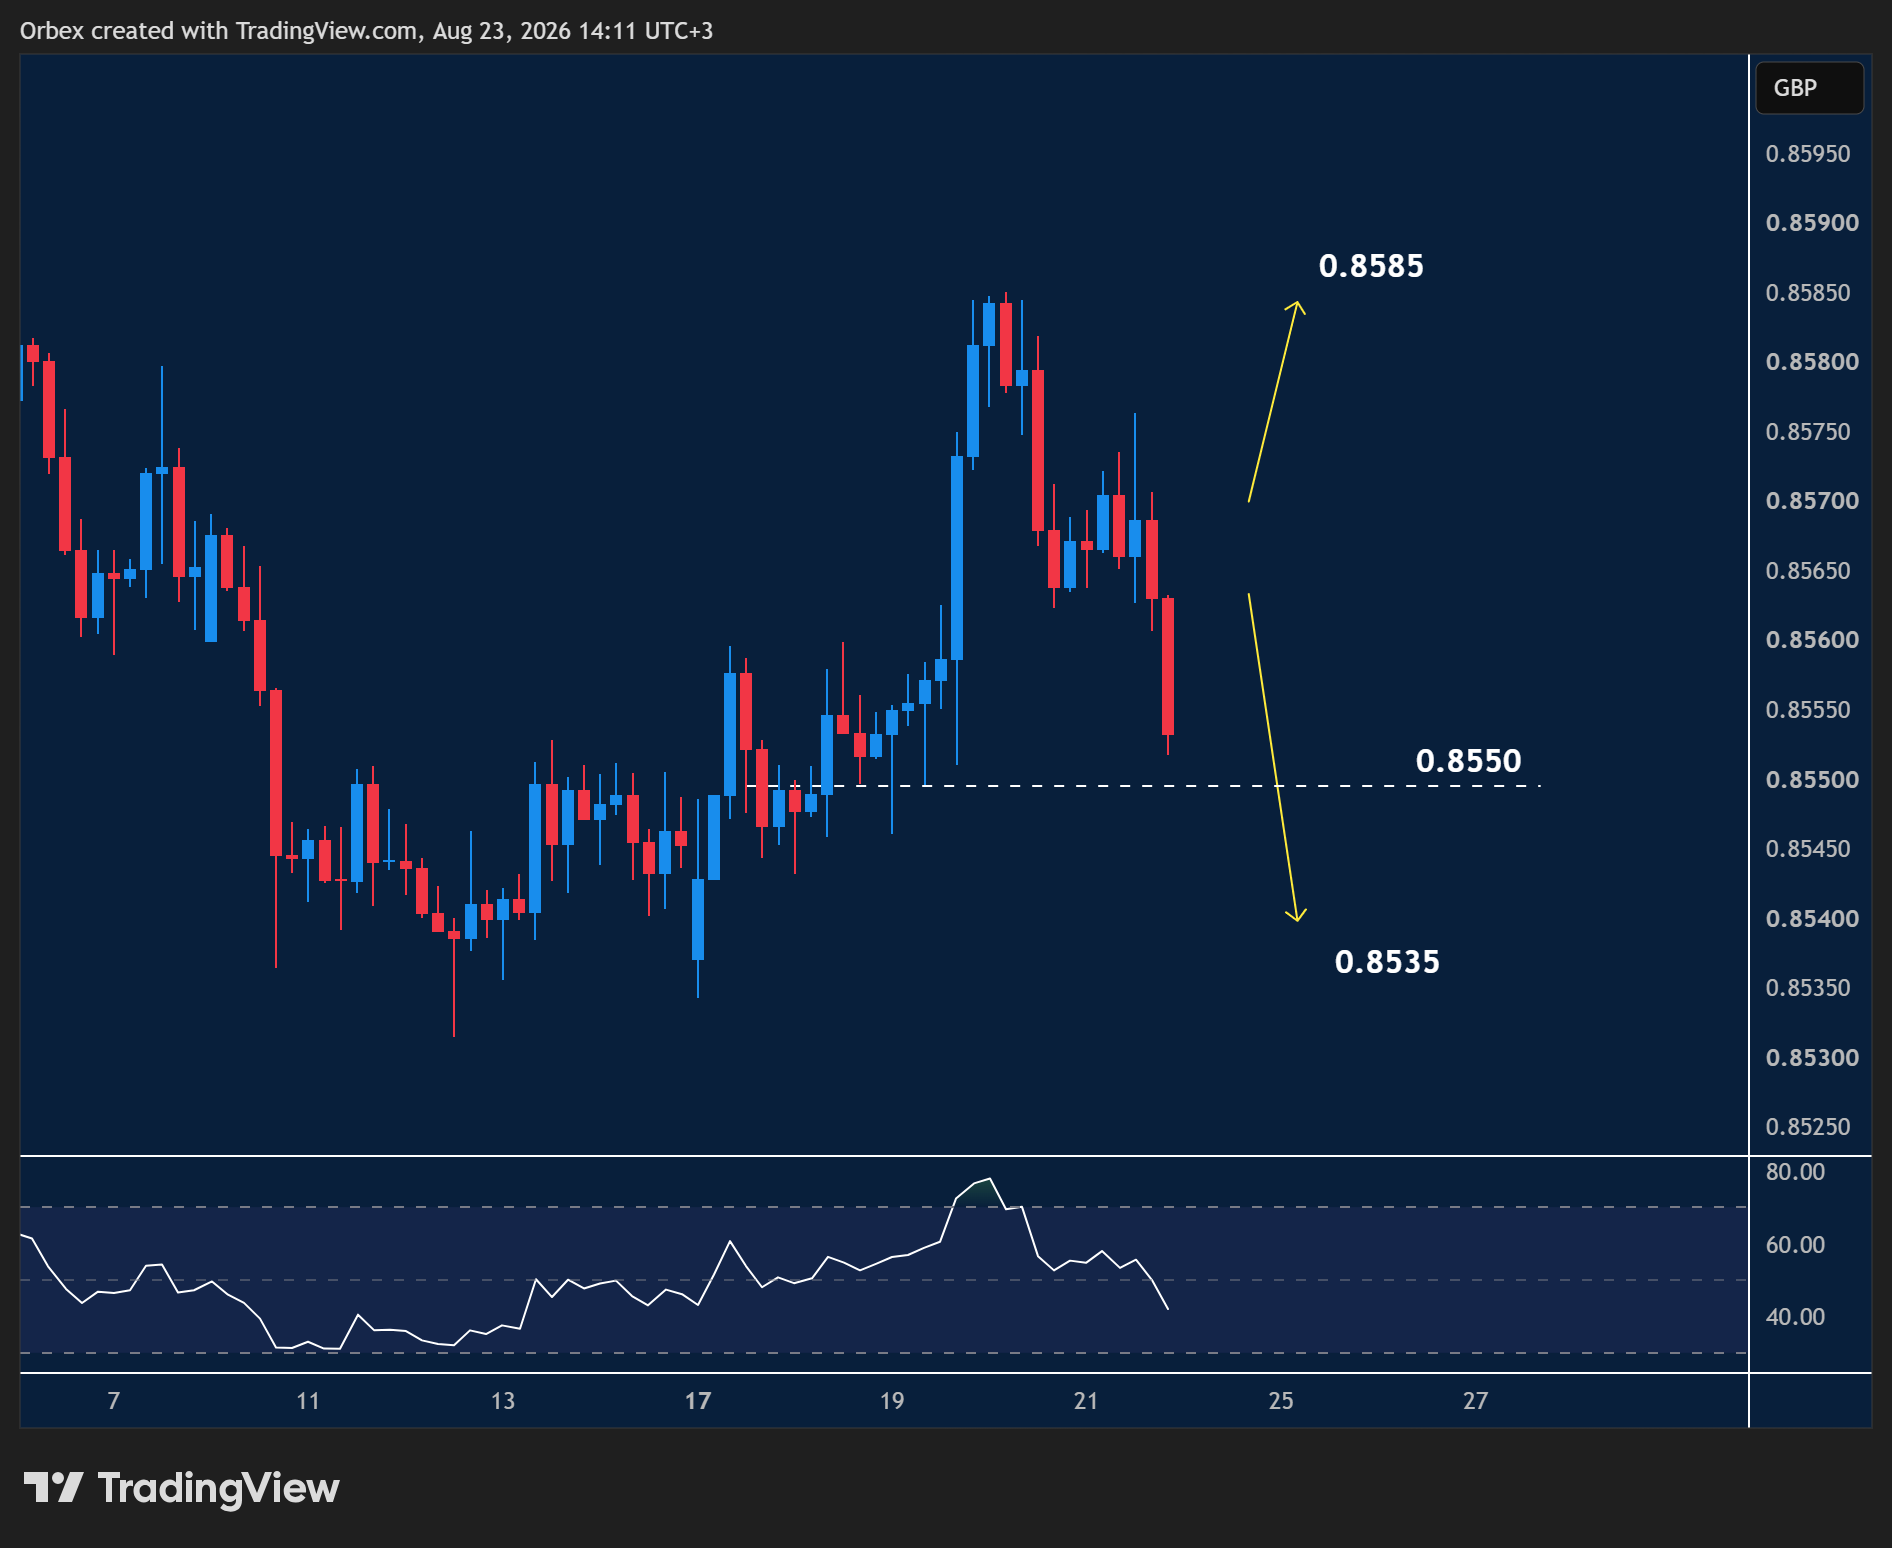
The pound maintained its bullish stance after hitting lower lows, which has pressured the pair.
- As price action remains in a bearish channel, the next divergence on the RSI will suggest either a loss of momentum or a continuation lower.
- A breach below 0.8550 would confirm another swing lower and prompt buyers to cover, with 0.8535 on the horizon.
- On the upside, a move above 0.8560 could trigger a turnaround towards the previous peak at 0.8585.
Trading the forex market requires extensive research, and that’s what we do best