
S&P 500 index turns lower
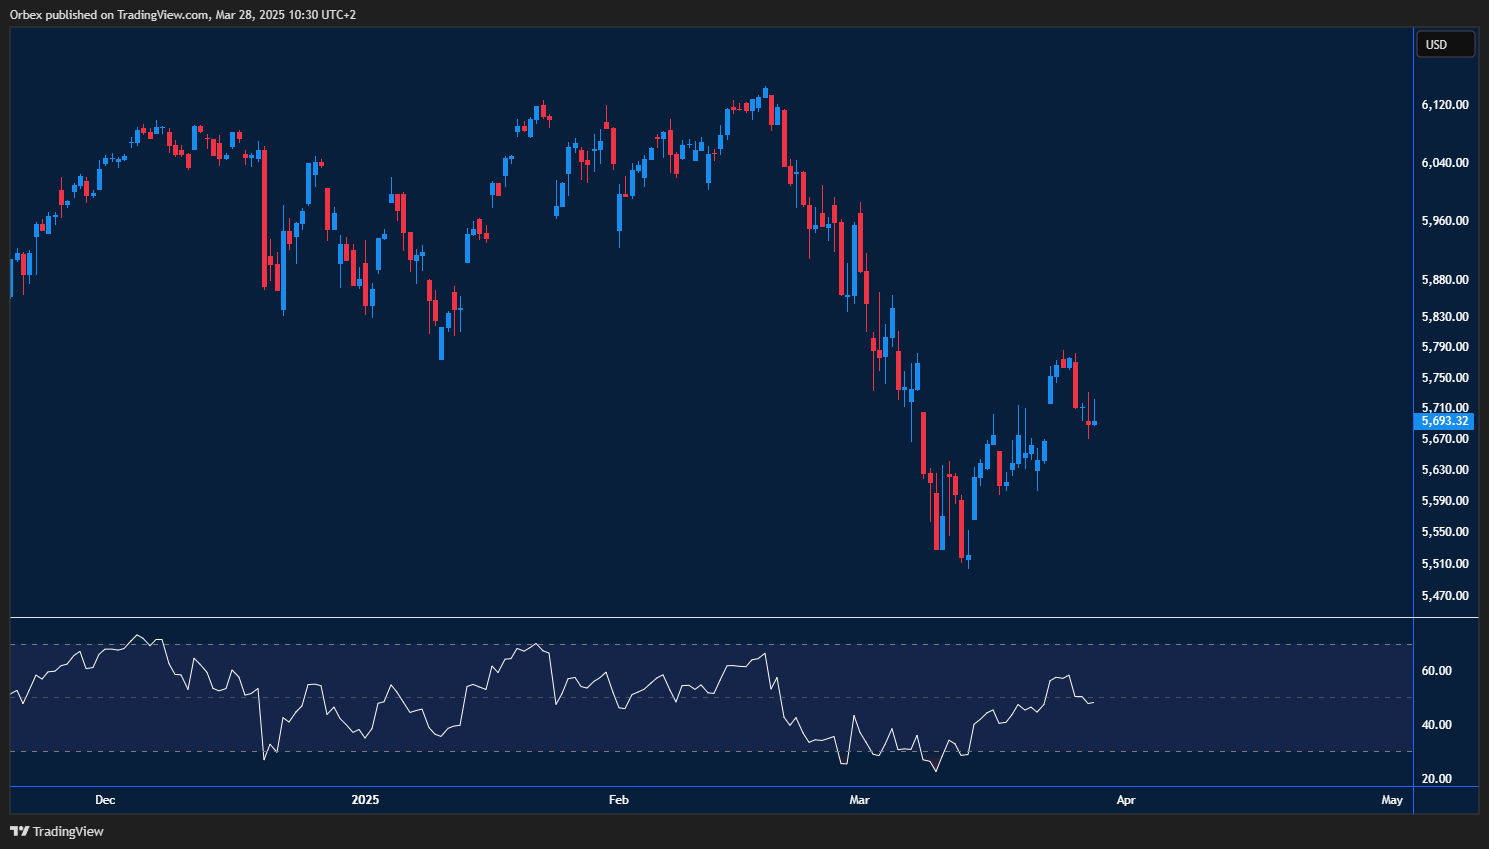
The S&P 500 index fell as traders worried that the recent tariffs could sink stock prices. The index is at a crossroads on the chart as prices hit the 5700 area again. A failure to lift bids to 5800 indicates that the downward pressure still lingers in the wake of the recent fall away from its recent progression. A drop below 5500 could see a sharp turnaround in fortunes for the index as the upcoming earning season looks at major declines in revenues.
USDJPY hitting firm resistance
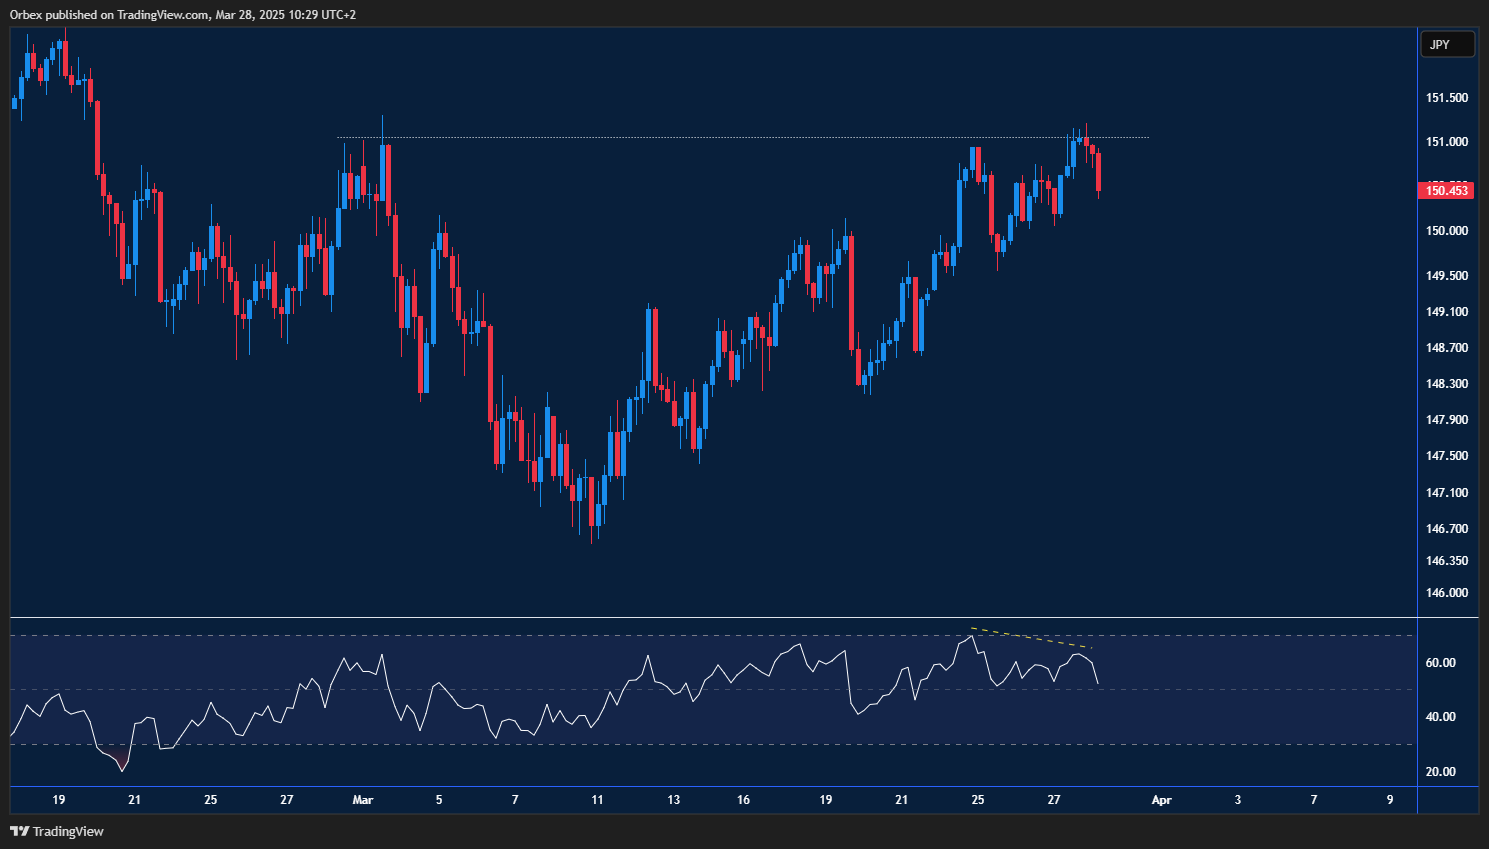

The Japanese yen gained traction after hitting a double top at the 151.00 level. On the chart, the pair has declined around 50 pips since the move as the RSI’s overbought situation has triggered an emergence of a bearish divergence, pulling prices lower. Bulls will need to clear 151.00 before they can push for a continuation above 151.70. On the downside, 149.80 would be a second layer of support.
USOIL climbing higher
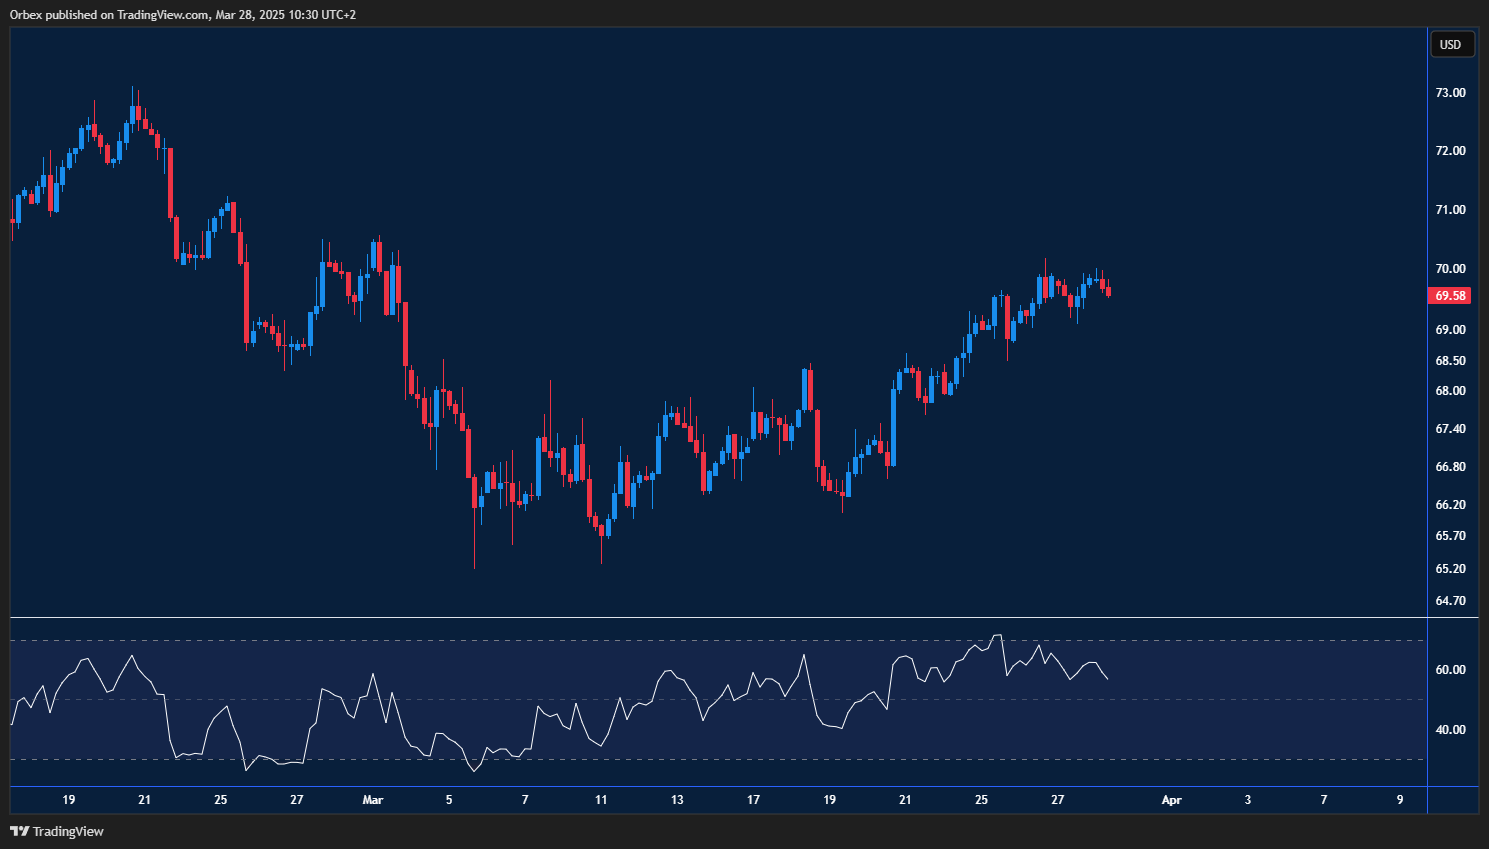
WTI continues to climb as the foreseeable outlook for Q2 sees increased demand for the black gold. After a lengthy consolidation, prices have now found themselves in a bullish channel. However, a fall below the first support of 68.50 could trigger a correction towards 67.40. With the price likely to continue its bullish path, oil is now looking to recapture the 70.00 handle in the near term. After that, another run at the top channel to 71.25 could be tested.

