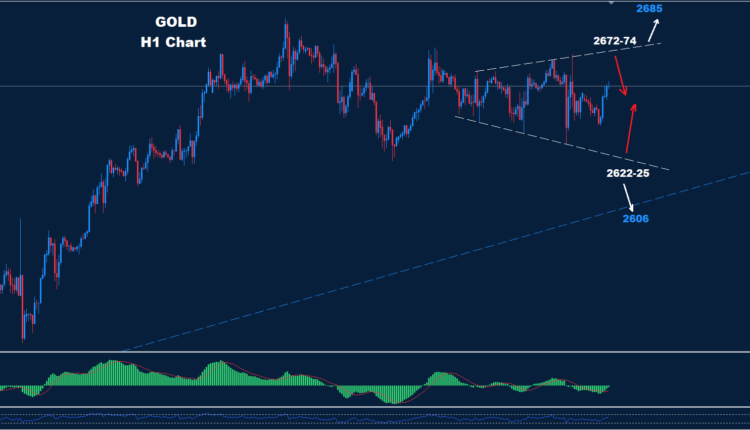
The intraday chart shows that Gold is forming a triangle pattern, with resistance around 2672-2674 and support between 2622-2625, creating a potential trading zone.
A break above 2674 could lead to further gains, with resistance at 2685 and 2700. Below 2622, a decline toward 2606 is expected.
| SUPPORT | RESISTANCE | |
| LEVEL1 | 2639 | 2672-74 |
| LEVEL2 | 2622-25 | 2685 |
| LEVEL3 | 2606 | 2700 |
|
Join our responsible trading community - Open your Orbex account now! |


