
EURUSD seeking support
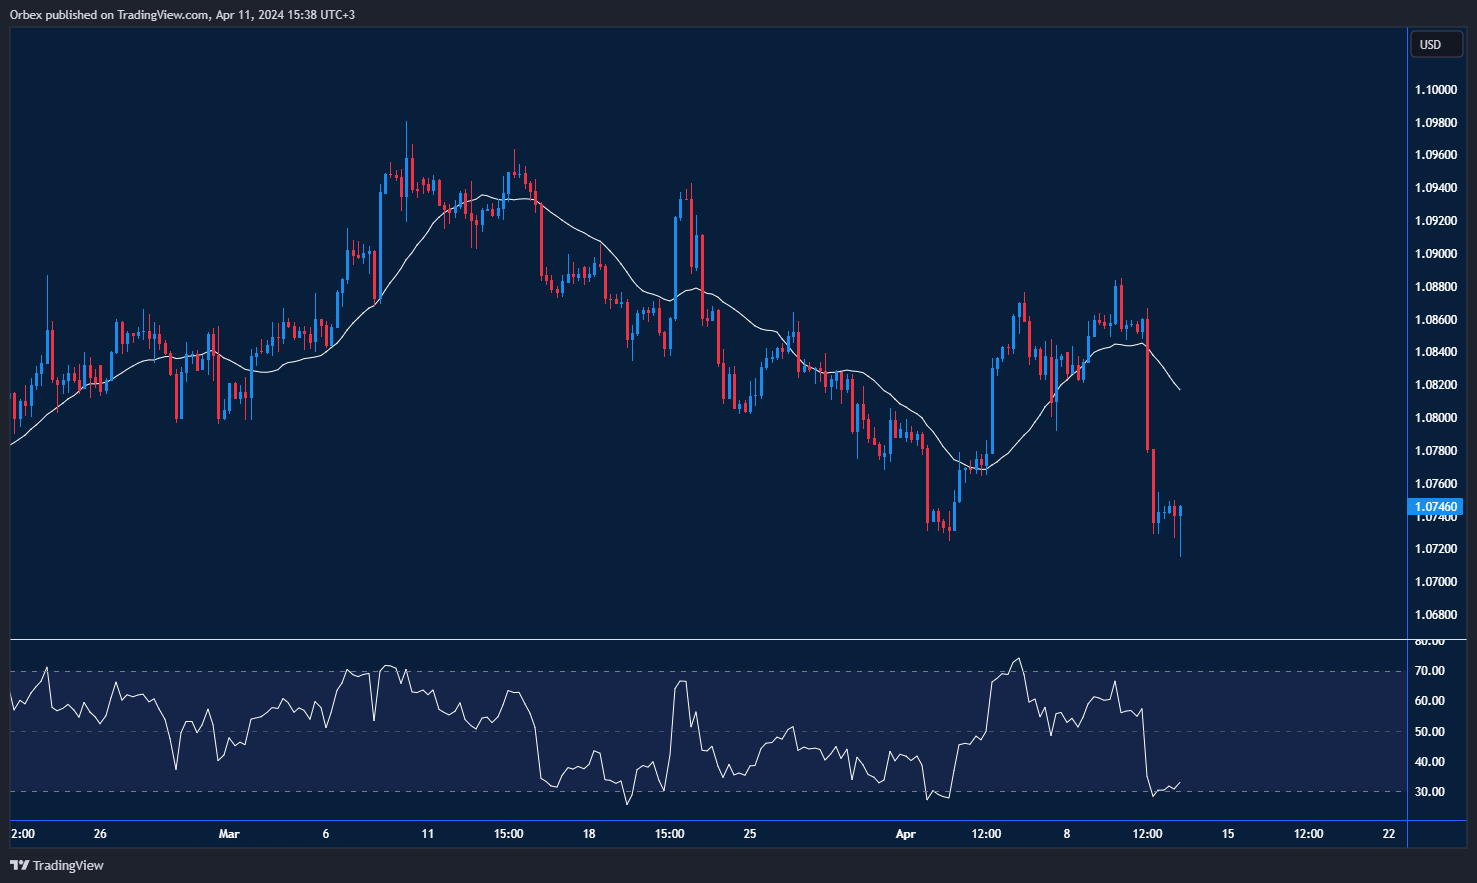
The US dollar rallied as annual inflation accelerated for a second straight month. A decisive break below 1.0800 has put the trend back on track as the pair moved over 100 pips at the beginning of April. A bearish extension could send the pair to 1.0700 in the upcoming days. A double dip in the oversold area on the RSI signalled a slowdown in momentum. A pullback above 1.0780 could trigger a correction with 1.0835 on the 20-day SMA as a backup level.
XAGUSD hits yearly high
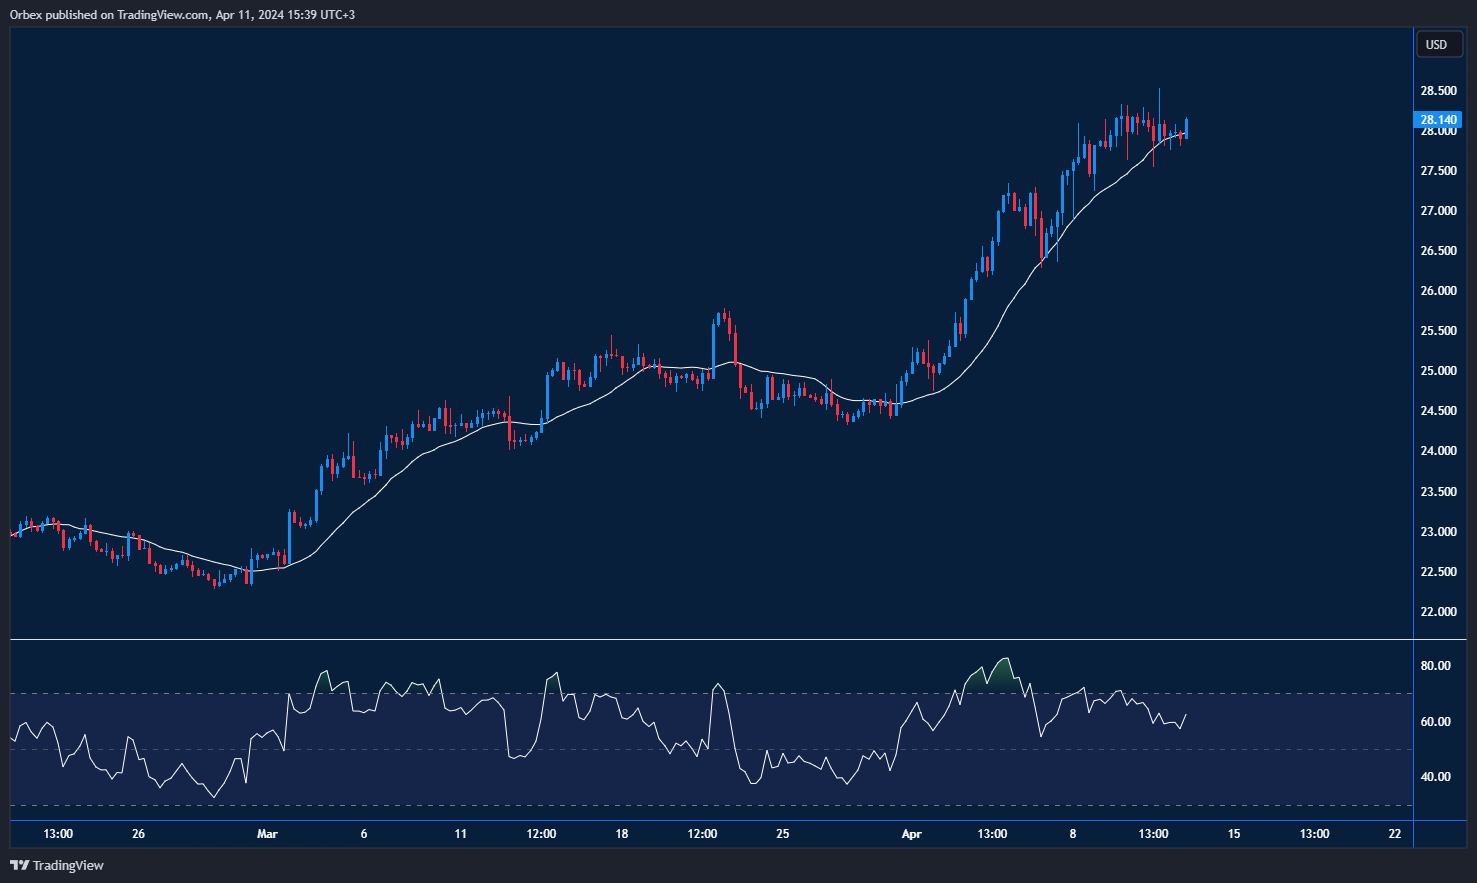
Silver maintains the rally to the upside as it hits a 12-month high. While sentiment has become highly bullish after a stellar rise, the RSI’s recent bearish divergence could give bears room to breathe. After a false spike stopped the momentum, the price now consolidates around the 28.00 level. A drop below 27.50 would suggest a lack of immediate follow-through, leading to a potential correction. Then 26.60 at the 20-day SMA would be a crucial floor.

UK 100 tests key resistance
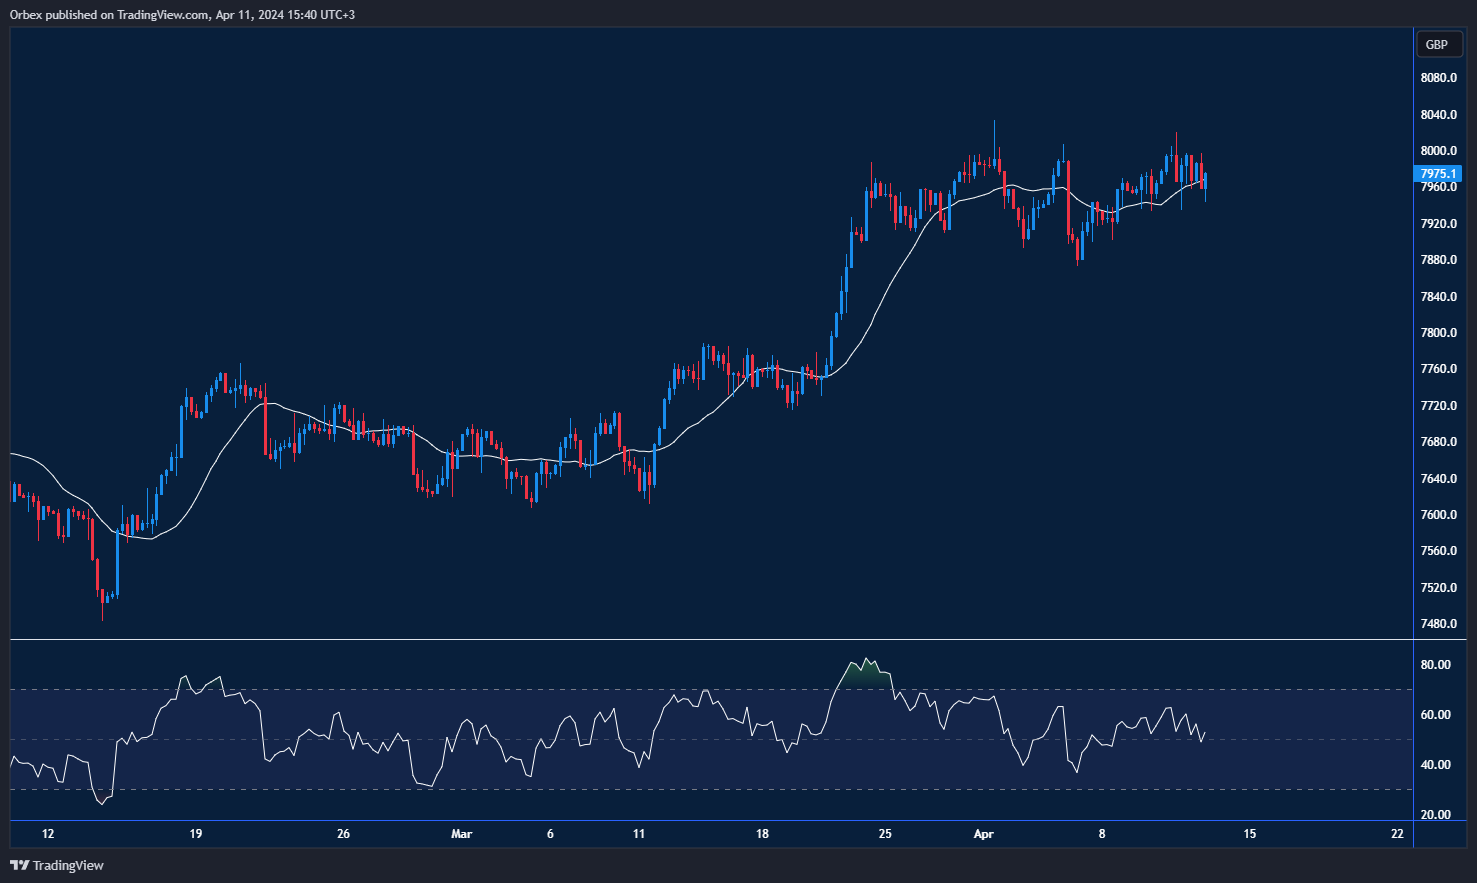
The FTSE 100 continues its sideways movement after failing to close above 8000. On the chart, after hitting a bottom at 7880, the rebound lifts the index back towards its previous peak. A bullish outcome would expose the recent peak, potentially leading to a continuation in the near term. On the downside, 7840 is the first support, while 7760 would be the bulls’ second line of defence.

