
EURUSD hitting resistance
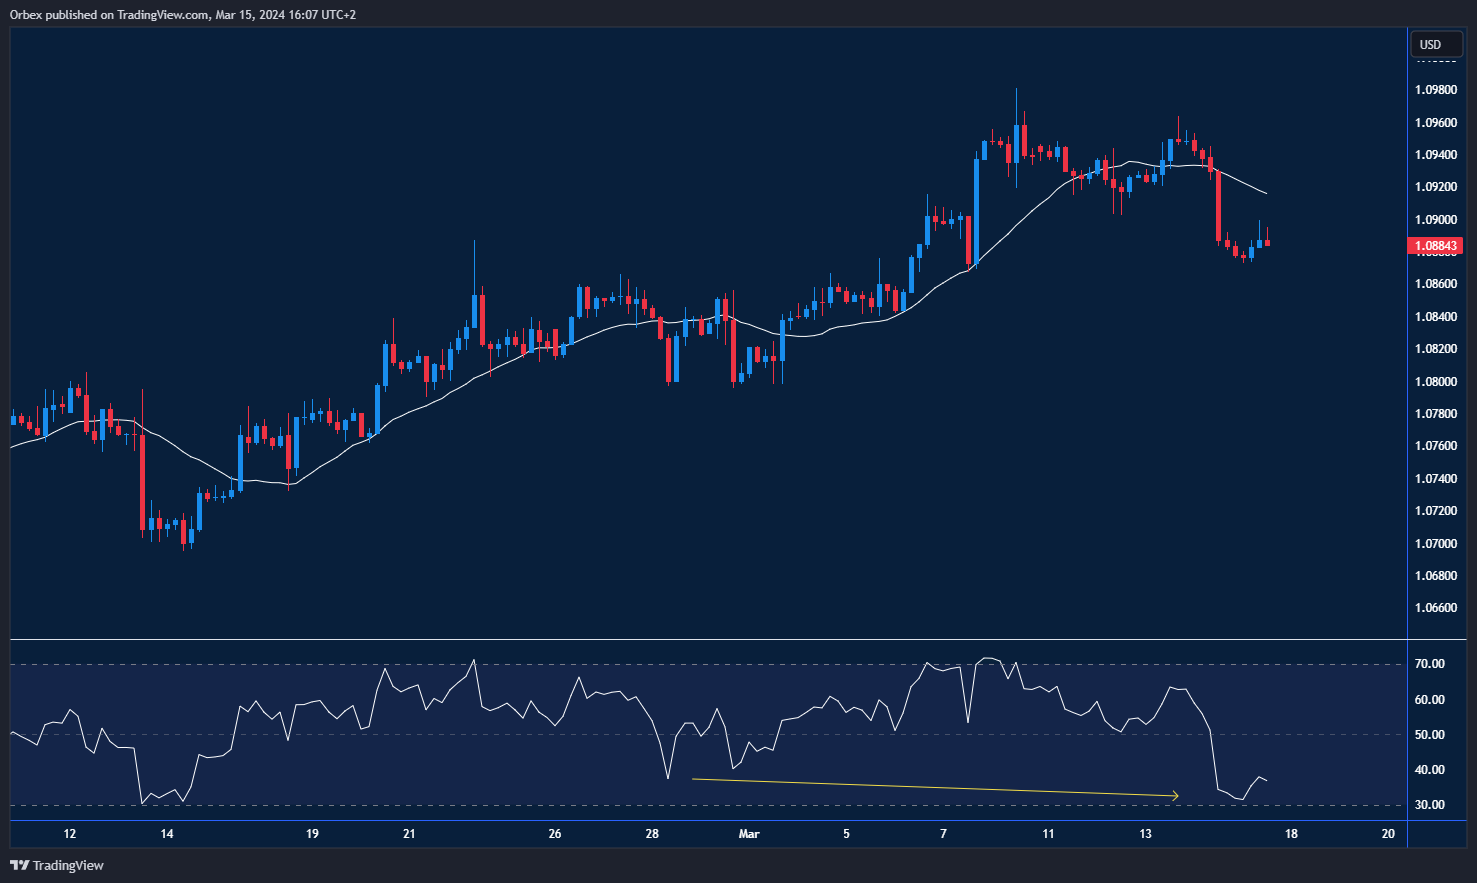
The US dollar gained over 80 pips as traders prepared for a dovish Fed testimony. A drop below 1.0930 shows strong bearish intent that the greenback is recovering. As the RSI dropped into oversold territory, a bullish divergence threatened to end the bear run. A close below the February low of 1.0700 would reinforce the downward bias and open the door to extending the supply zone to around 1.6500.
USDCAD bounces back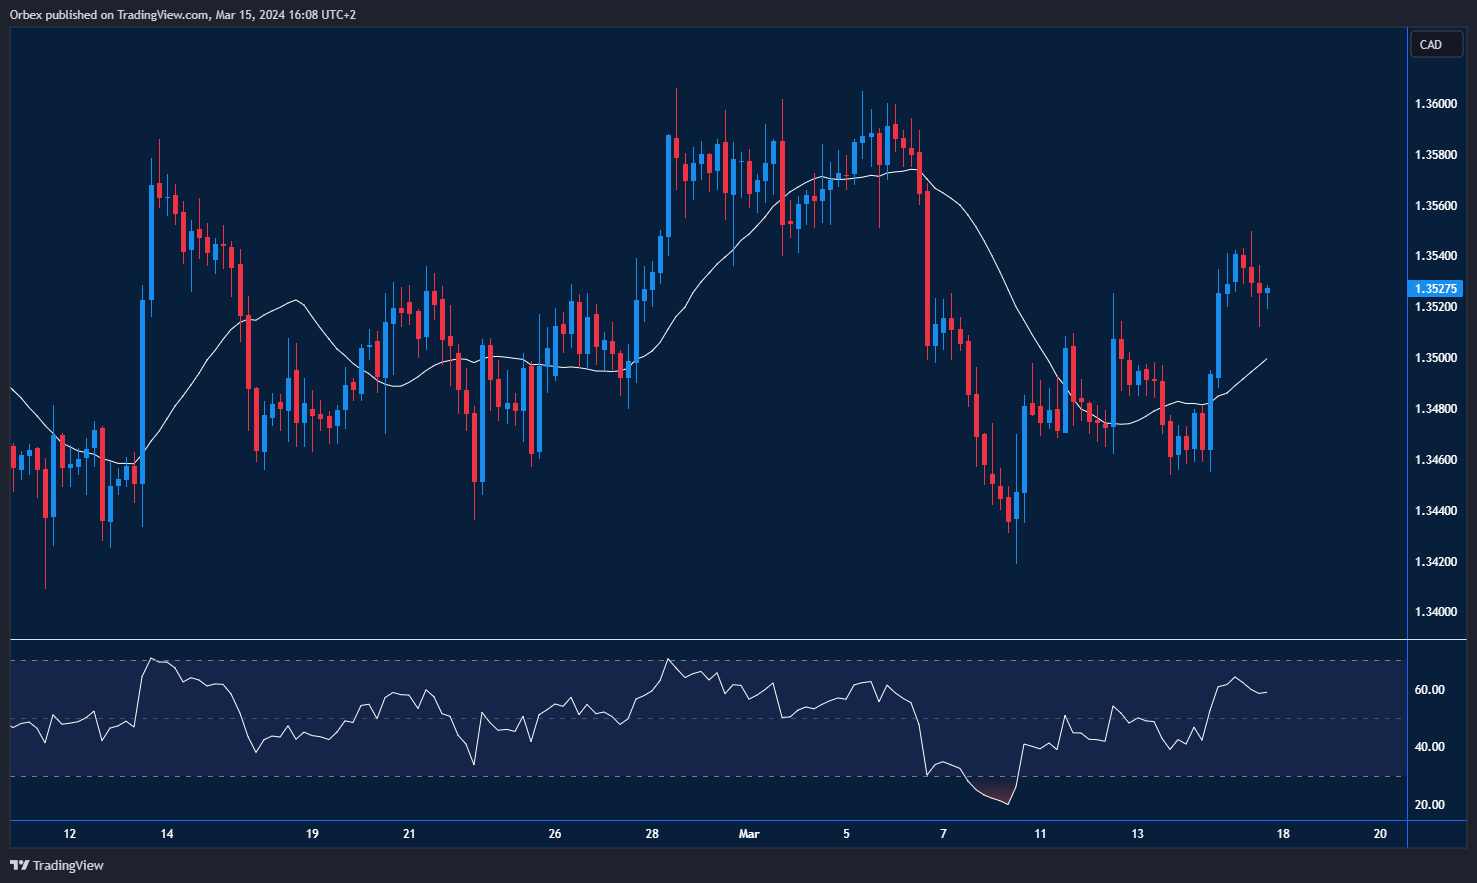

The Canadian dollar slipped as robust US data continues to lift the greenback. Overall, sentiment remains upbeat from the daily chart’s perspective. A break above 1.3500 over the 20-day SMA has again caught buyers’ eyes. A successful rebound would keep the greenback on the front foot. 1.3560, right under the recent peak of 1.3600, is a crucial hurdle and its breach would extend gains towards 1.4000.
UK 100 jumps out of bullish channel
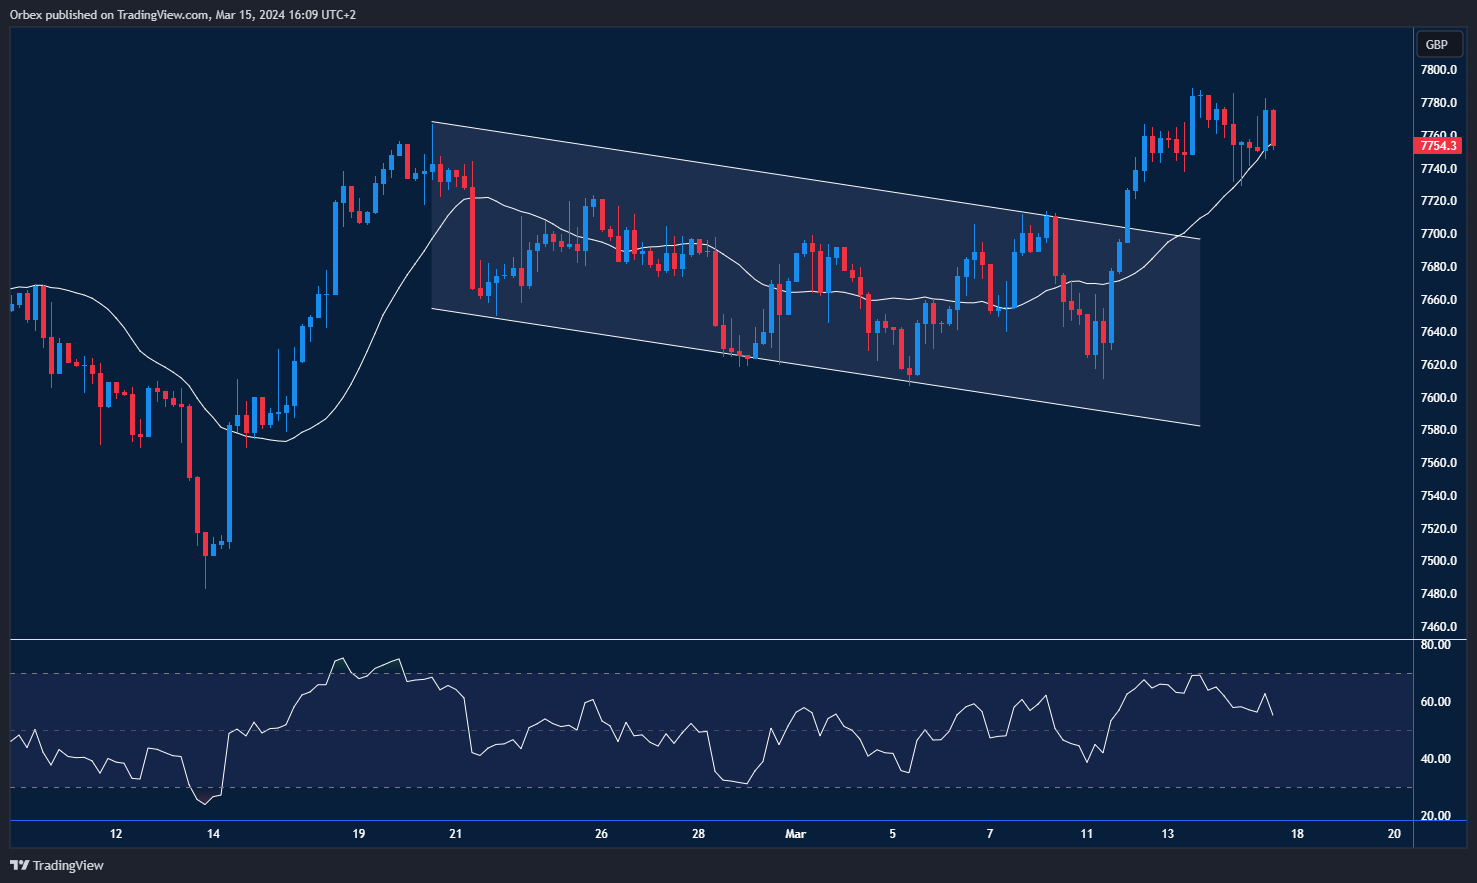
The Equities have recovered in Europe as investors reposition ahead of the Fed decision. A surge above last week’s high of 7700 has alleviated the pressure on the FTSE 100, but the sell side is not safe yet. 7780 is a key resistance where new sellers could drive the bids lower. 7720 is fresh support in case of further hesitation, and a break back into the channel can see bids fall towards 7580.

