
The FTSE 100 falling from its peak
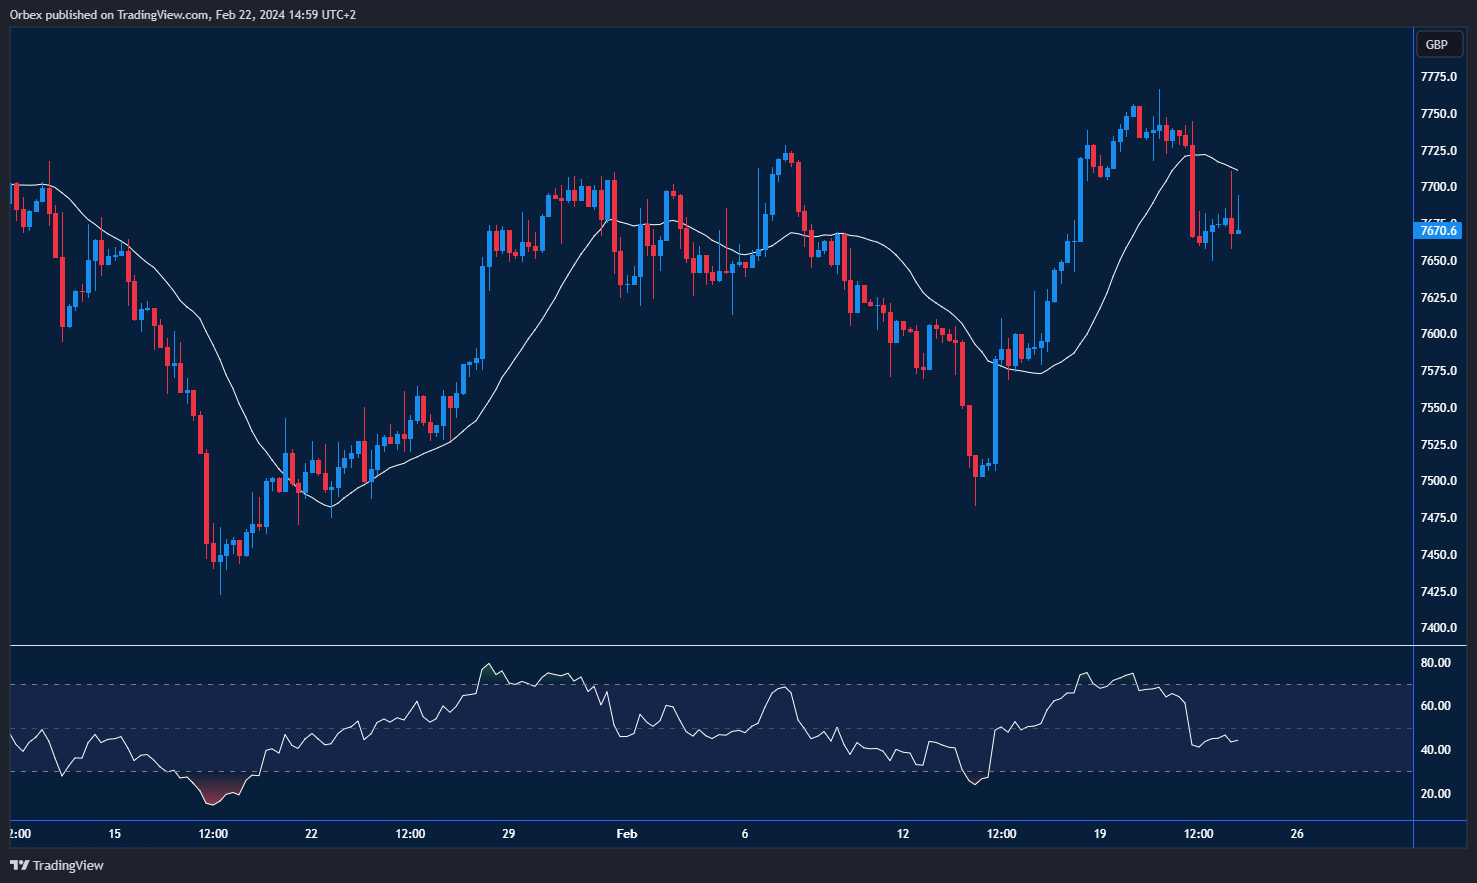
The FTSE 100 turned lower on fears of a deep recession in the second quarter. The RSI’s overbought condition indicates overextension, though there is no confirmation of a fallback yet. 7650 is the immediate support, and its breach could open a bear rally in the next few sessions. 7500 would be a key level to gauge the strength of follow-up interests. On the upside, a close back above 7750 would resume the uptrend.
EURUSD bounces back
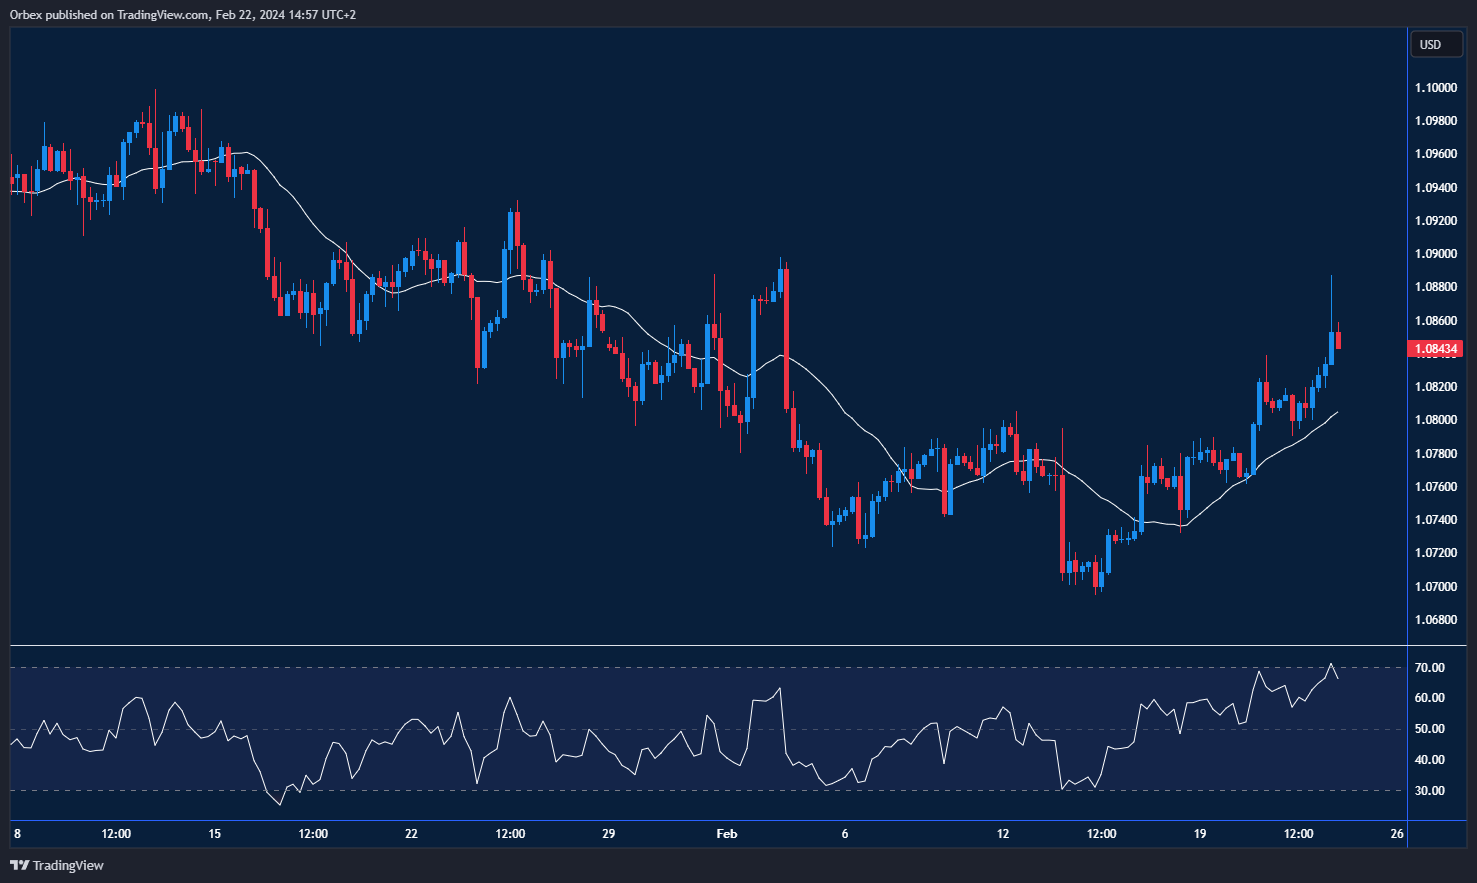
The Euro extended gains helped by upbeat PMIs in February. The bounce away from the 20-day moving average suggests a correction is due after a long bearish rally. The pair has moved over 100 pips higher as the greenback ran out of steam. 1.0880 is the next hurdle before a full recovery can be confirmed, with the 1.09 level in sight. Failing that, resistance at 1.0840 could see a slight correction retest to 1.08 soon.

USDCAD hitting higher highs
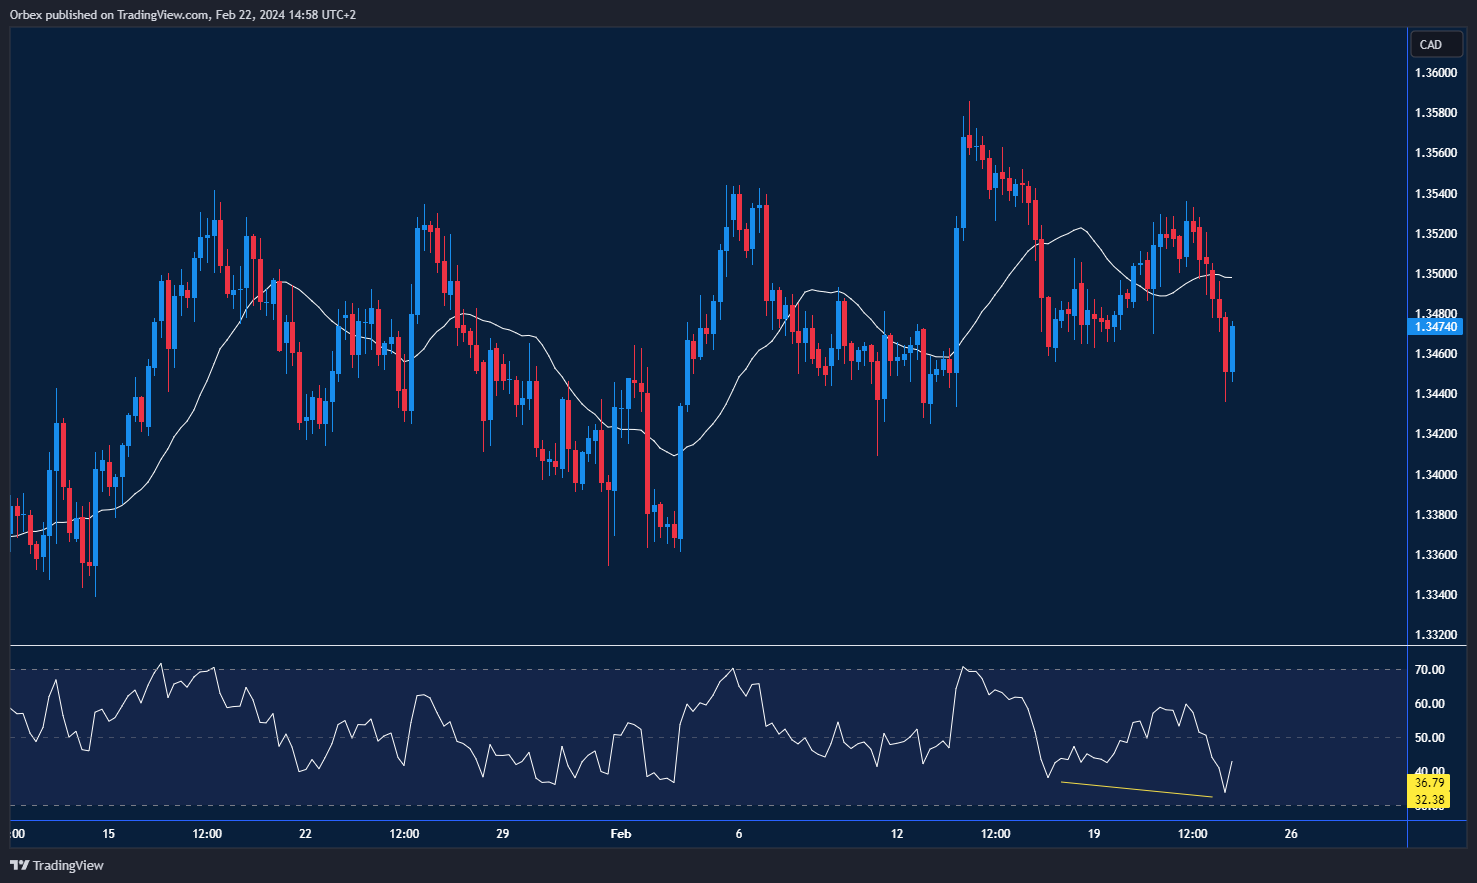
The Canadian dollar fell from its peak towards 1.36 as easing inflation kept the BoC subdued. With a series of higher highs benefitting the pair, the current downside move has hopes of a turnaround and that bulls could regain control of the direction. 1.3440 is a fresh support, and 1.3360 is a critical level to keep the upward bias intact, with a bullish divergence in play. Some resistance could be felt near the previously failed move at 1.3530 before the rally could extend to the daily resistance of 1.3580.
Test your forex trading strategy with Orbex

![Credit Card 160×600 [EN]](https://assets.iorbex.com/blog/wp-content/uploads/2023/06/13144507/Blog-Banner_EN-Banner_160X600X2.webp)