
USDCHF tests crucial floor
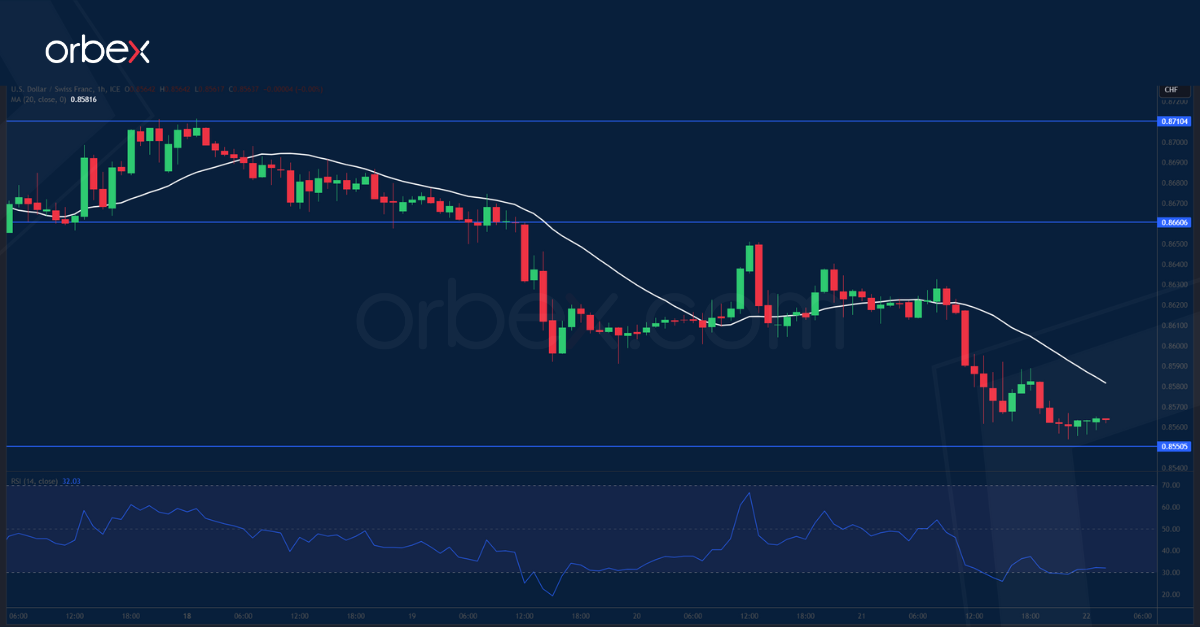
The US dollar slipped after the GDP in the third quarter was revised down. The price is heading towards July’s low of 0.8550 as sentiment remains wary about the US dollar’s general softness. A ‘buy-the-dips’ behaviour could be expected as the daily RSI shows another oversold condition in this significant demand zone. 0.8660 is the first hurdle to clear. Failing this, a bearish breakout would trigger a wave of liquidation and invalidate last summer’s rebound, leading to prolonged weakness in the weeks to come.
XAUUSD stays positive
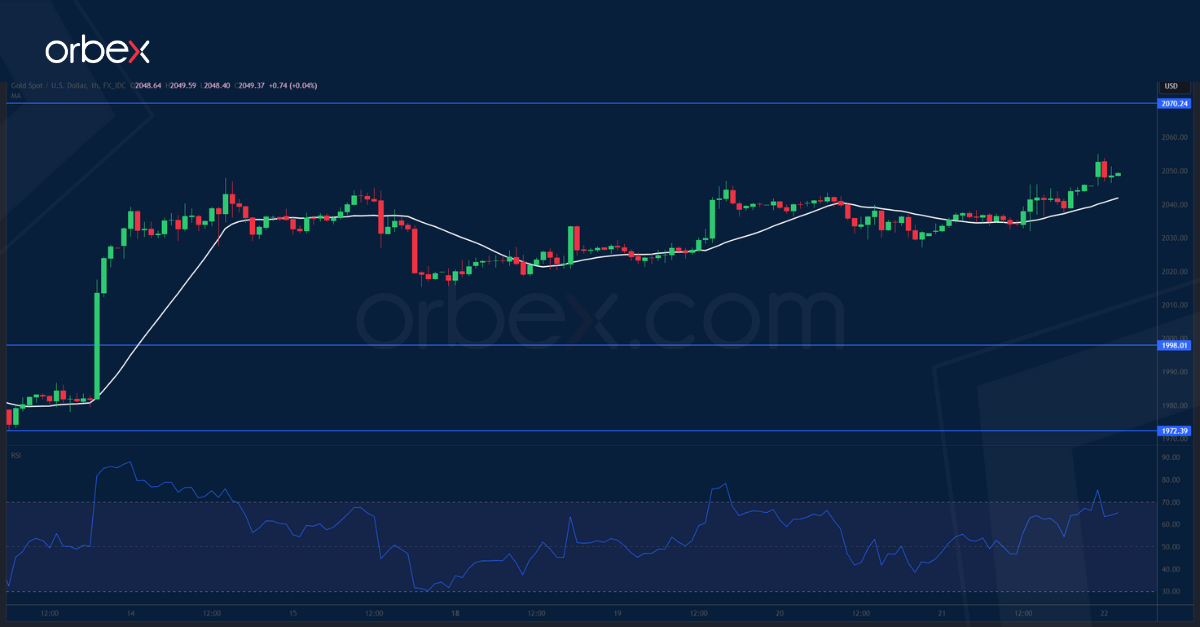
Gold advances as the dollar retreats amid lacklustre economic data. A swift comeback above 2040 suggests that the bulls are still in the game despite a temporary retreat. Sentiment is positive from the daily chart’s perspective and the precious metal could be looking to consolidate its gains before another round of rally. Buyers may see the current situation as an opportunity to accumulate as long as the quote stays above the demand zone 1972-1998. A close above 2070 may resume the climb above the recent spike of 2140.

NAS 100 stalls on profit-taking
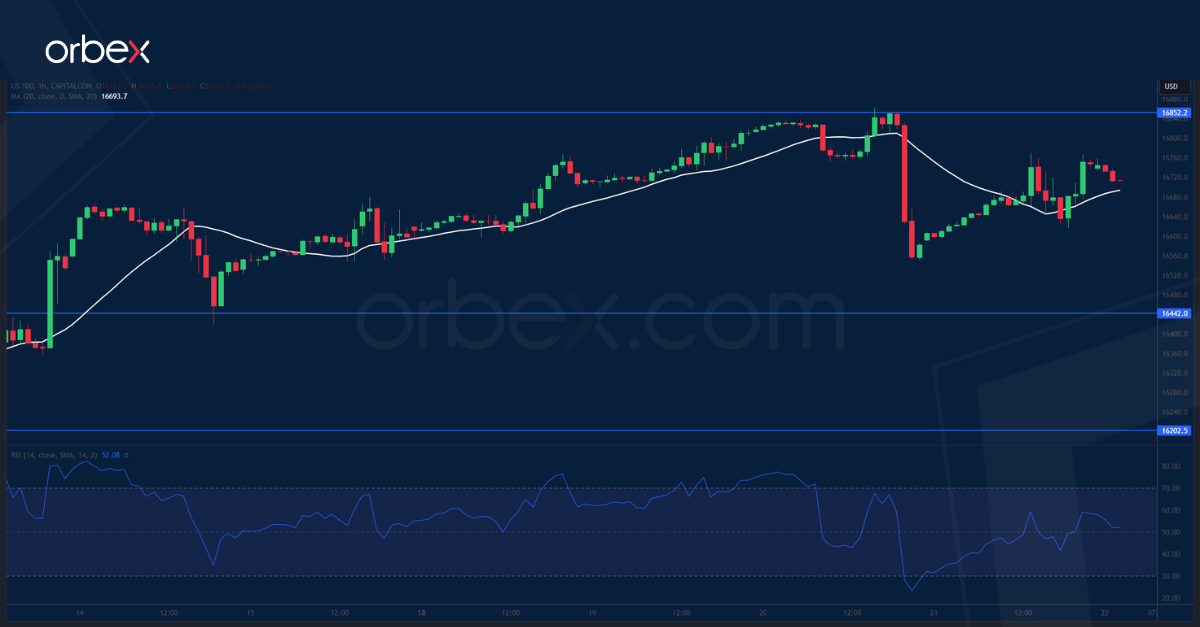
The Nasdaq 100 bounces as investors buy dips betting on monetary easing early next year. The index has established 16850 as the latest peak after it broke above its two-year high of 16750. But an overwhelmingly overbought RSI on the daily chart might make the short-term bulls think twice before keeping their gains throughout the festive season. A snapback below 16600 is the sign of profit-taking. 16440 is a key level to gauge the strength of follow-up interests and a lack of which would expose 16200 on the 20-day SMA.

