
NZDUSD probes support
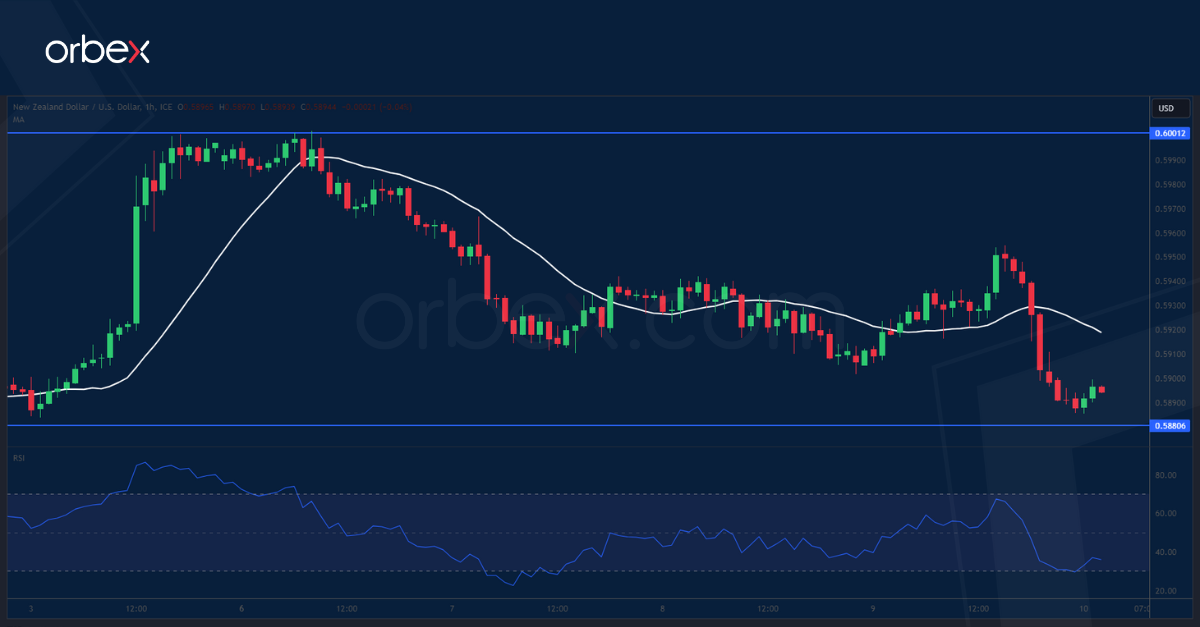
The New Zealand dollar pulls lower as commodity prices come under pressure. The recent rally came to a halt at the psychological level of 0.6000 near the start of the mid-October sell-off. A break above this major supply area will be necessary to trigger a recovery to 0.6200. 0.5880 is the first support to maintain the latest momentum and the RSI’s oversold condition has attracted some follow-up interests. Further down, the recent bottom of 0.5790 is a critical floor to prevent a fresh round of sell-off.
XAGUSD struggles to bounce

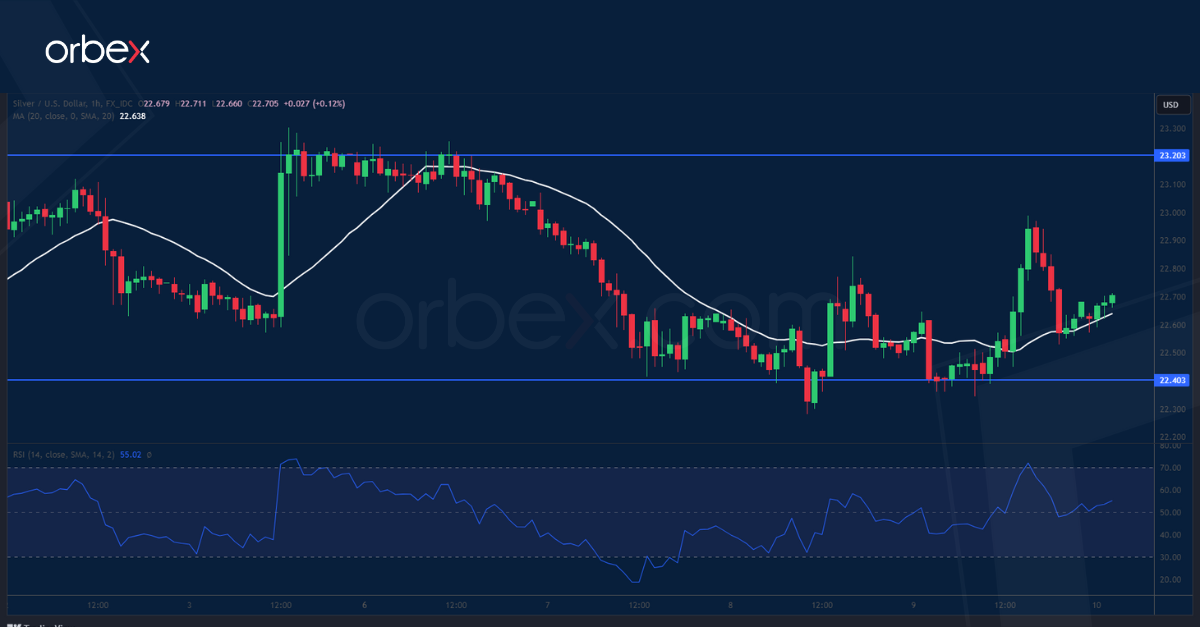
Silver strives for support as the US dollar remains firm across the board. The price is still looking for fresh catalysts after it reached the daily resistance level of 23.70. The lengthy consolidation might be an opportunity for the bulls to take a breather before they could break higher. The tip of a previously faded bounce at 23.20 is a key hurdle to lift to turn short-term sentiment around. 22.40 is the first support and 21.75 an important support to keep buyers interested as its breach would expose last month’s low of 20.70.
SPX 500 hits resistance
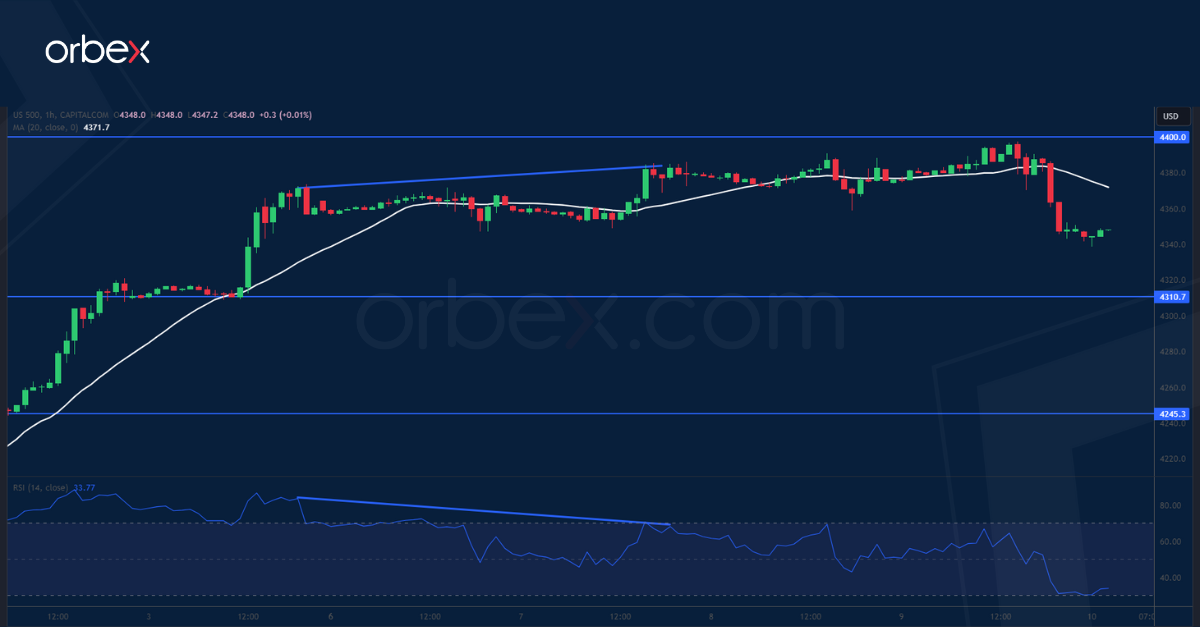
The S&P 500 snapped back after Fed Chair Jerome Powell sowed doubt about the end of rate hikes. On the daily chart, the index is testing the swing high of 4400 from last October. A bearish RSI divergence indicates a loss of momentum probably due to a combination of fresh selling and profit-taking in this congestion area. 4310 then 4245 are the next two layers in case of a correction. However, a bullish breakout would force sellers to scramble for the exit and open the door to an extended rally to 4500 next to the September peak.

