
USDJPY tests resistance
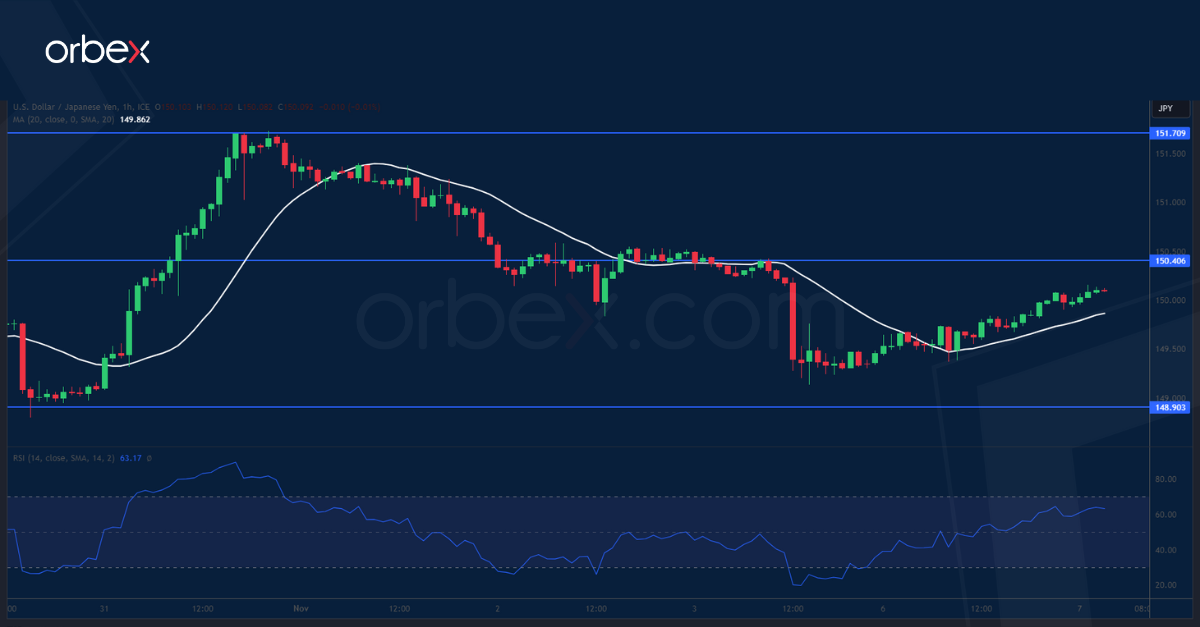
The lack of concrete signs from the BoJ to normalise its monetary policy continues to take a toll on the yen. Coming off its 12-month high of 151.70, the pair is looking to hold onto its recent gains above the double dip around 148.90. A breakout would confirm a mounting bearish pressure and invalidate the last leg of rally with 147.40 as a potential target should the buy side start to exit their positions. On the upside, 150.40 is the first threshold to clear to expose the said peak before a bullish continuation could take hold.
EURGBP seeks support

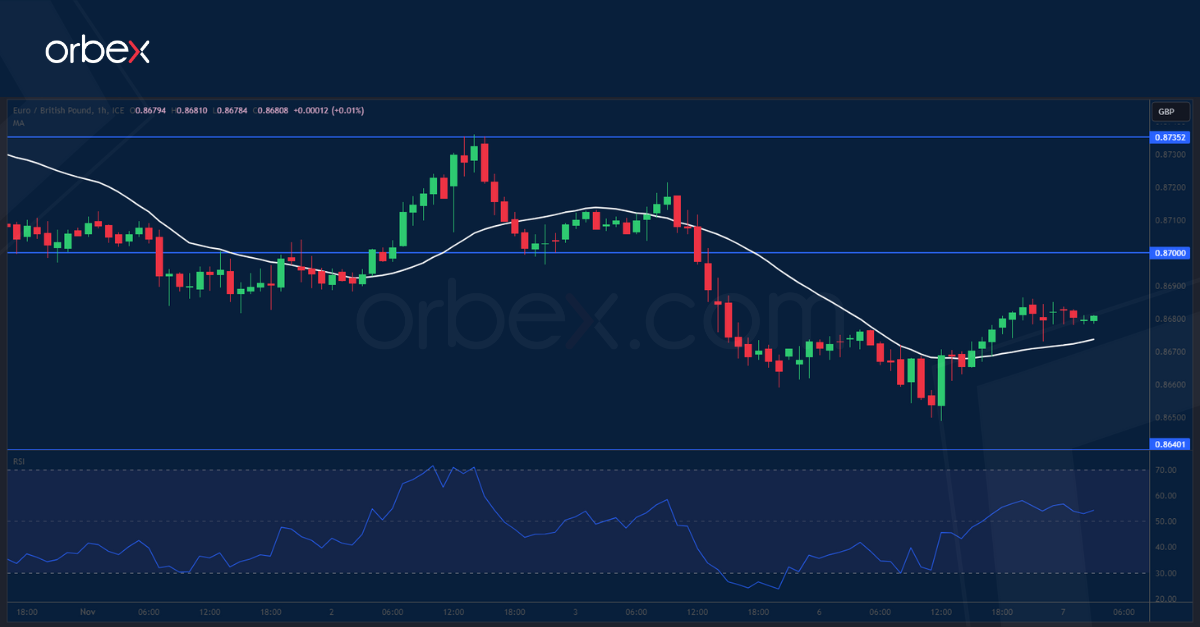
The pound slipped as a soft UK construction PMI raised worries about the economy. On the daily chart, the price is pulling back after reaching a 6-month high and October’s swing low of 0.8620 is critical in keeping the bullish bias intact. In the near term, the quote is still probing for support after intraday buyers threw in the towel. As the RSI sank into the oversold area, 0.8640 is the next level to look for signs of stabilisation. On the flip side, the previous demand area of 0.8700 is the hurdle to clear to help the bulls regain initiative.
XAUUSD consolidates gains
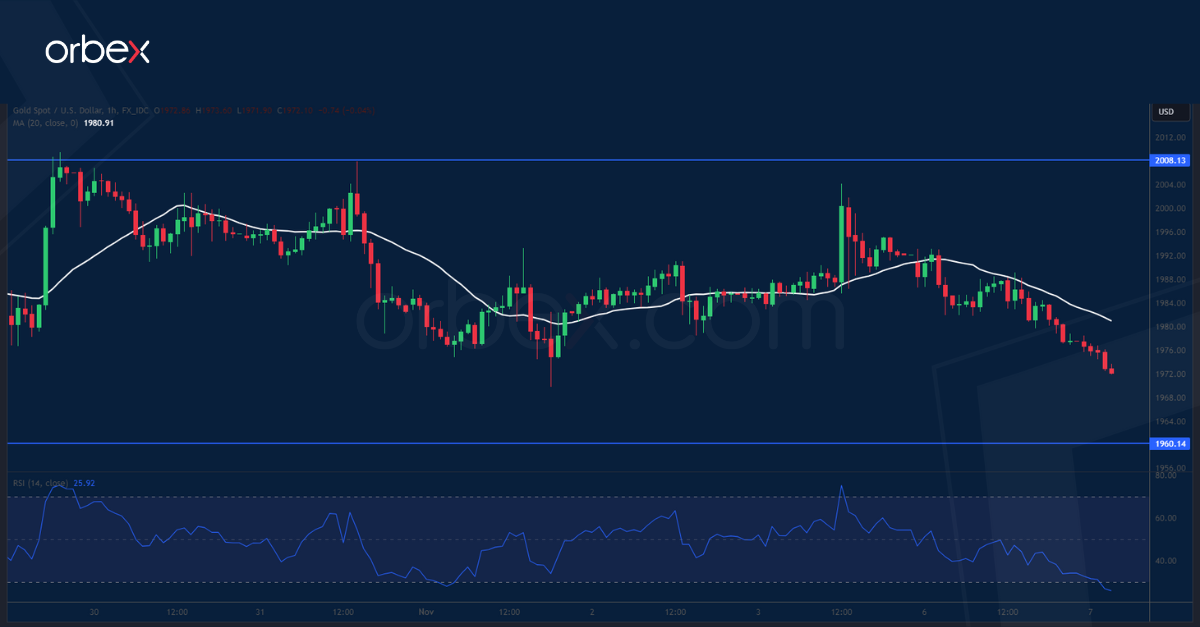
Gold drifts lower as the US dollar firms up ahead of Jerome Powell’s speech on Wednesday. The current horizontal consolidation is an opportunity for the bulls to take a breather after a vertical ascent last month. The confluence of a previous swing low of 1960 and the 20-day SMA is a key level to expect follow-through buying, where a lower candle shadow indicates a rejection of lower bids, keeping the price steady. A close above 2008 would attract trend followers looking to ride the next phase up with 2050 as a target.

![Credit Card 160×600 [EN]](https://assets.iorbex.com/blog/wp-content/uploads/2023/06/13144507/Blog-Banner_EN-Banner_160X600X2.webp)