
USDCAD breaks higher
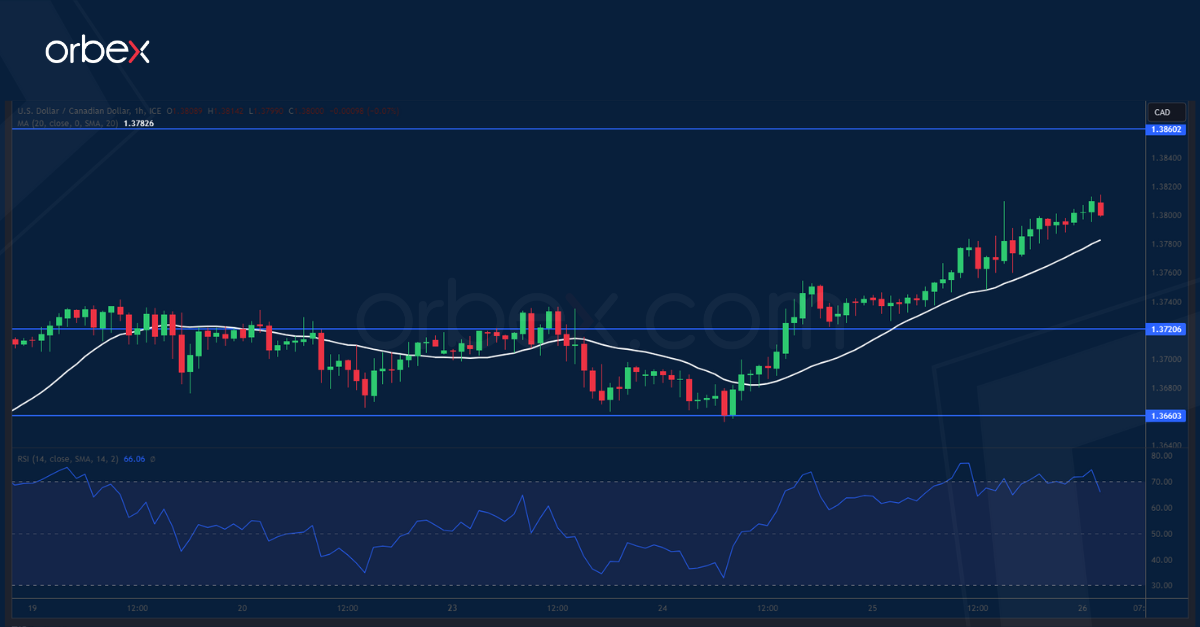
The Canadian dollar weakened after the BoC left its interest rates unchanged. The pair has capitalised on its bounce off the 20-day SMA (1.3580) and a close above 1.3780 indicates that the bulls have made their way back. Last March’s high of 1.3860 could be the short side’s last line of defence and its breach may end the year-long sideways action and resume the greenback’s climb in the weeks to come. As the RSI ventures into the overbought area, limited profit-taking could send the quote lower to its fresh support at 1.3720.
USOIL tests support

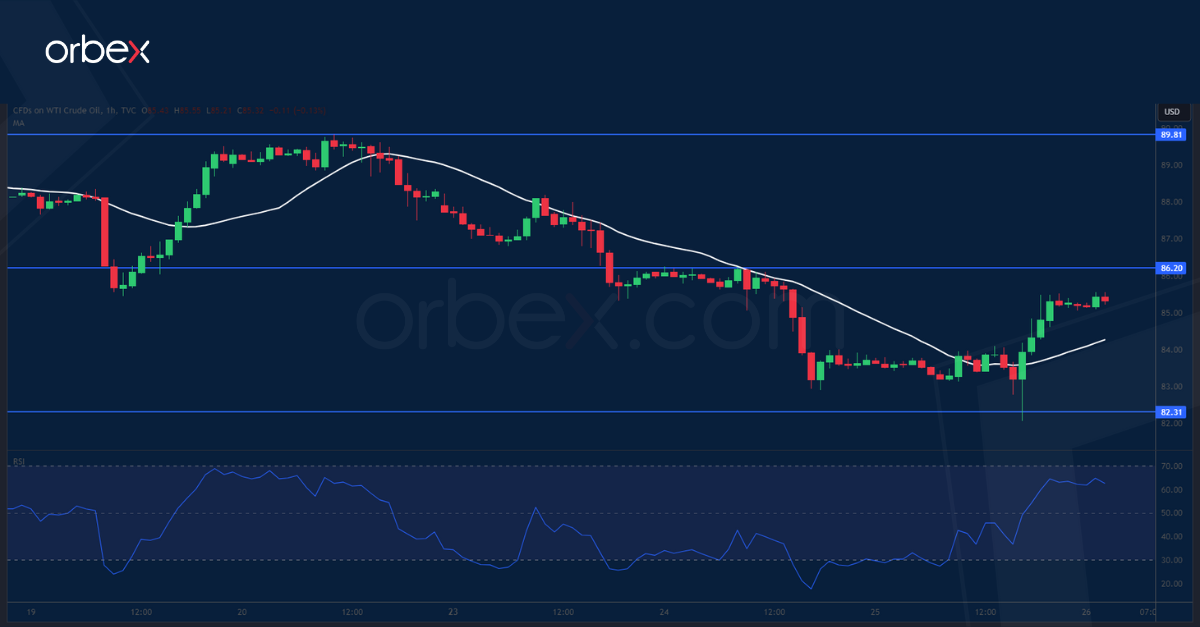
WTI crude jumped back on heightened geopolitical risk in the Middle East. On the daily chart, the price is consolidating its gains after achieving a fresh 12-month high. While sentiment remains upbeat in the medium-term, the previous support-turned-resistance of 89.80 has proved to be a tough level to crack for now, prolonging the correction. 82.30 at the bottom of the recent rally is an important floor to maintain the momentum as a breakout may trigger a sell-off to 80.00. 86.20 is the hurdle to clear to ease the pressure.
UK 100 attempts to rebound
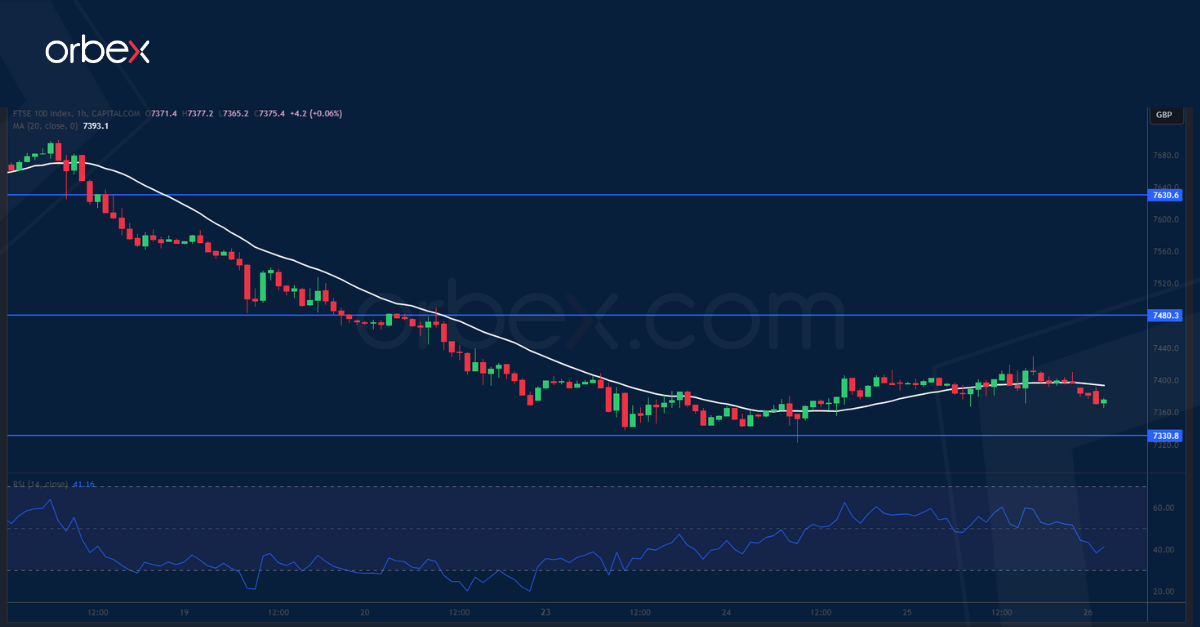
The commodity-heavy FTSE 100 inched higher on news of China’s fresh stimulus measures. A drop below the daily support of 7400 has invalidated the rebound attempt from early September, putting the buy side on the defensive. The price crawling up is a sign of profit-taking by short-term sellers. 7480 is the immediate resistance where the bears could be expected to fade the bounce. Only a break above 7630 would improve the market mood. On the downside, a fall below 7330 would lead to a new round of sell-off.

