
USDCHF looks for support
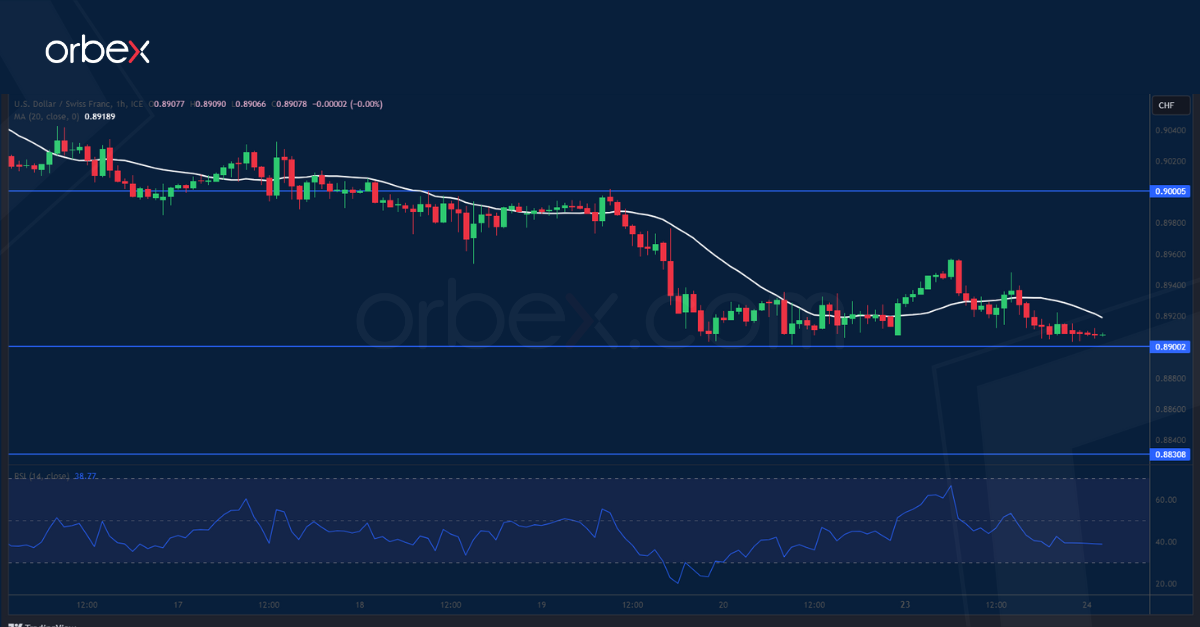
The US dollar drifted lower as Treasury yields pulled back from its 16-year high. The greenback has retraced half of its gains from the summer rally and is striving to hold onto its edge at the round number of 0.8900. The psychological level of 0.9000 is the first hurdle to clear to alleviate the selling pressure. Then the tip of a previously faded rebound at 0.9090 is a key resistance standing before a bullish continuation. On the downside, a fall below 0.8900 would put buyers’ resolve to the test by exposing 0.8750.
NZDUSD struggles to stabilise

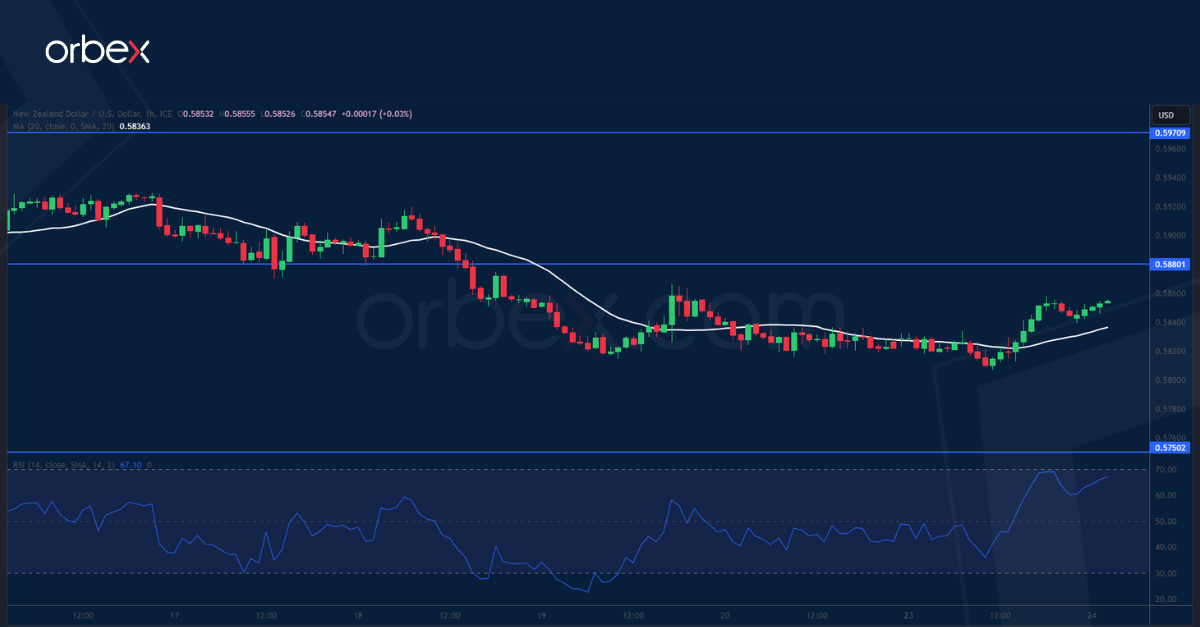
The New Zealand dollar ticked higher as overall risk sentiment took an upbeat turn. A fall below the demand zone 0.5860-0.5880 has renewed the bearish pressure and put those who bought the latest bounce on the defensive. Last November’s low of 0.5750 is the next threshold to see if meaningful buying would emerge and turn the tide, or the kiwi could sink towards its 12-month low of 0.5500. The support-turned-resistance of 0.5880 is the first layer of resistance and only a close above 0.5970 would signal a bullish reversal.
US 30 tests critical floor
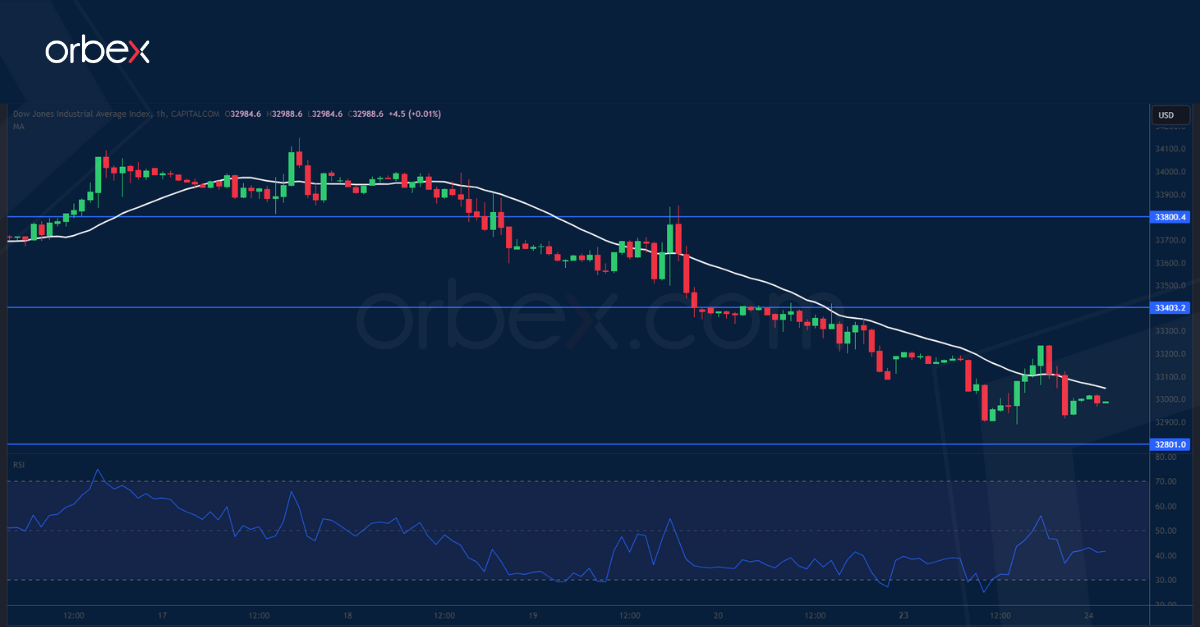
The Dow Jones 30 steadies as investors expect strong quarterly revenue growth in Q3. The price has given up most of its gains from the bounce early this month. As the RSI drops into the oversold area, the base at 32800 is a double bottom on the daily chart, making it an important support to keep the bullish bias intact in the medium-term. Its breach would label the recent rally as a ‘dead cat bounce’ and trigger an exodus of buyers while attracting momentum sellers. 33400 is the immediate resistance overhead.

