
AUDUSD turns south
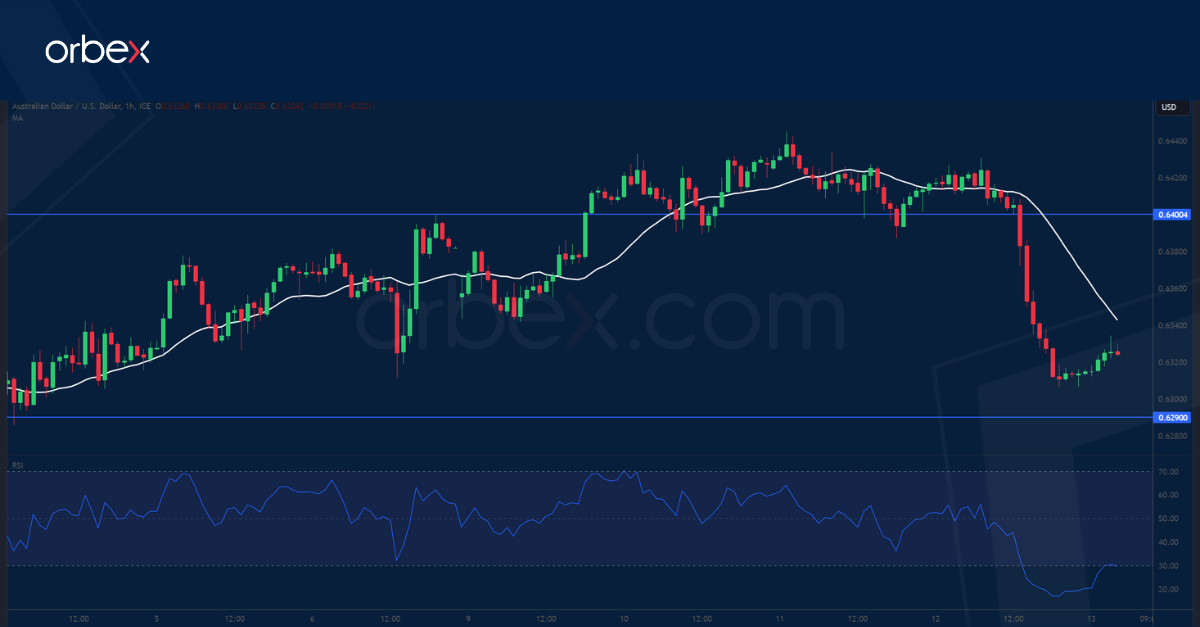
The US dollar soared after consumer price growth beat expectations in September. The aussie had recouped most of the losses from the sell-off near the end of September. However, the peak of the previous rebound at 0.6500 has remained a major obstacle and out of reach as the price turned south. A drop below 0.6345 signals that the path of least resistance is down, making the price vulnerable to a fall below 0.6290 where a bearish breakout would send the pair to its 12-month low of 0.6180. 0.6400 is now a fresh resistance.
GBPUSD probes support
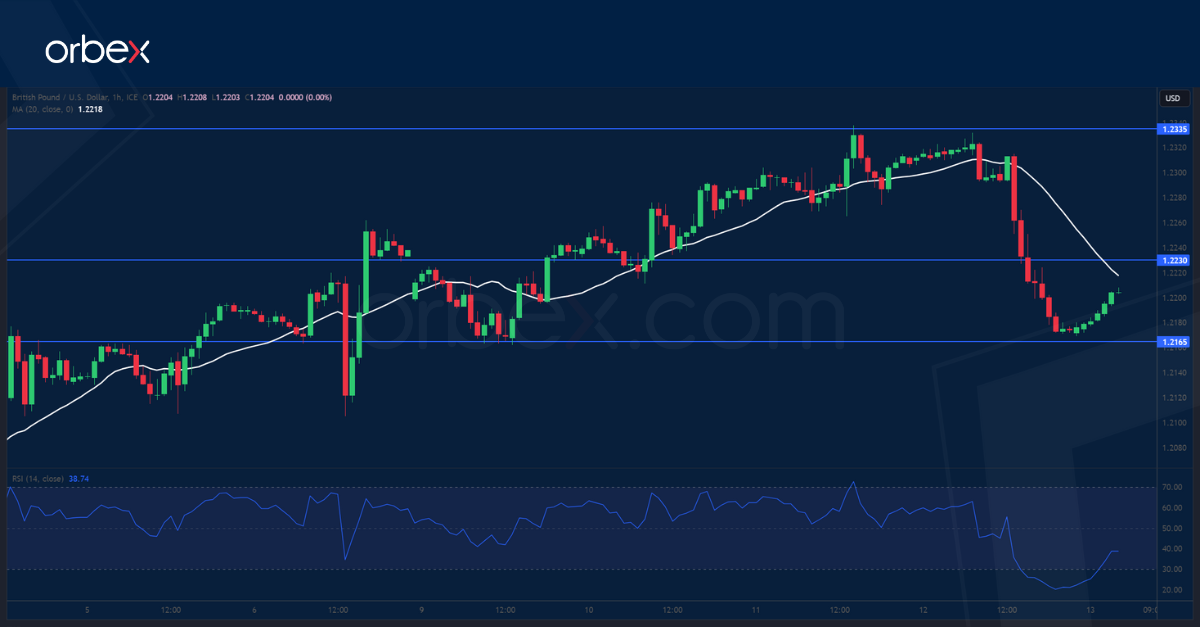

Cable tumbles as sluggish British growth pales in comparison with persistent US inflation. A combination of profit-taking from the sell side and buying from those looking to capitalise on the rebound had pushed the pair past the dynamic resistance of the 20-day SMA to the former demand zone around 1.2350. This major cap has so far held on as the downward pressure took over, lowering bids past 1.2270 then 1.2200. A fall below 1.2165 would trigger a correction to the bottom at 1.2050. 1.2230 has turned into a resistance level.
SPX 500 breaks lower
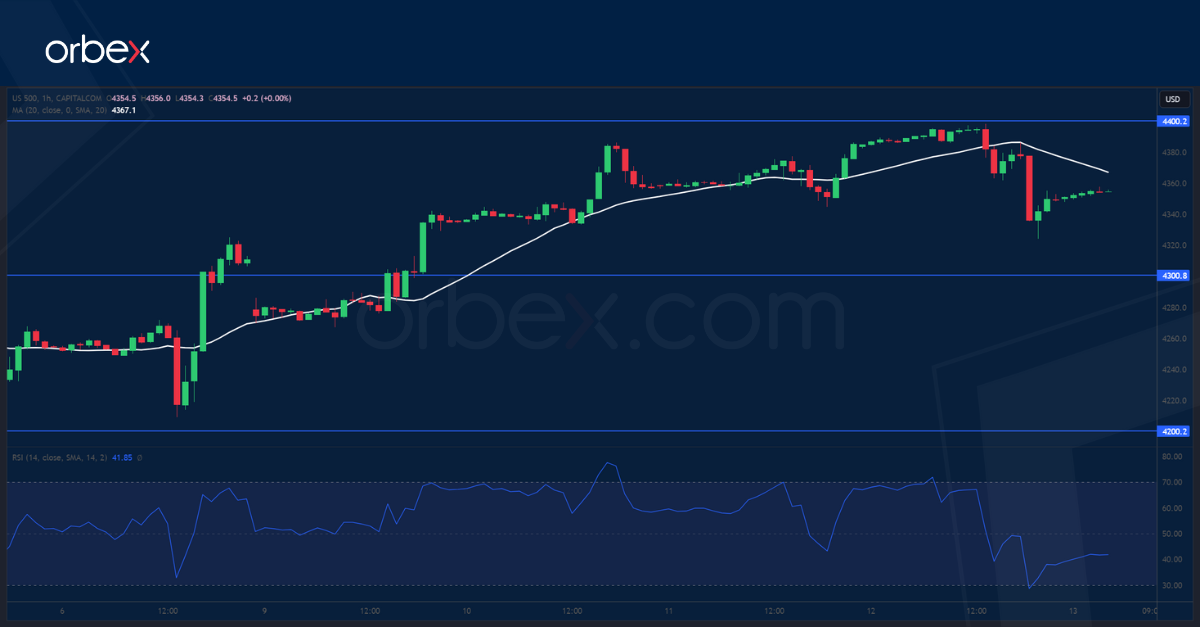
The S&P 500 plunged as US inflation numbers failed to ease worries about further tightening. The index has met stiff selling at the former daily demand area around 4400, putting the latest buyers on the defensive. A liquidation below 4350 may dent the bulls’ confidence by revealing weak follow-through interests, and the sell side would see it as an opportunity to fade the rebound in the hope of a broader correction. 4300 at the base of a bullish breakout rally is the next level to see if buyers have enough resolve to offer support.

