
USDJPY grinds major resistance
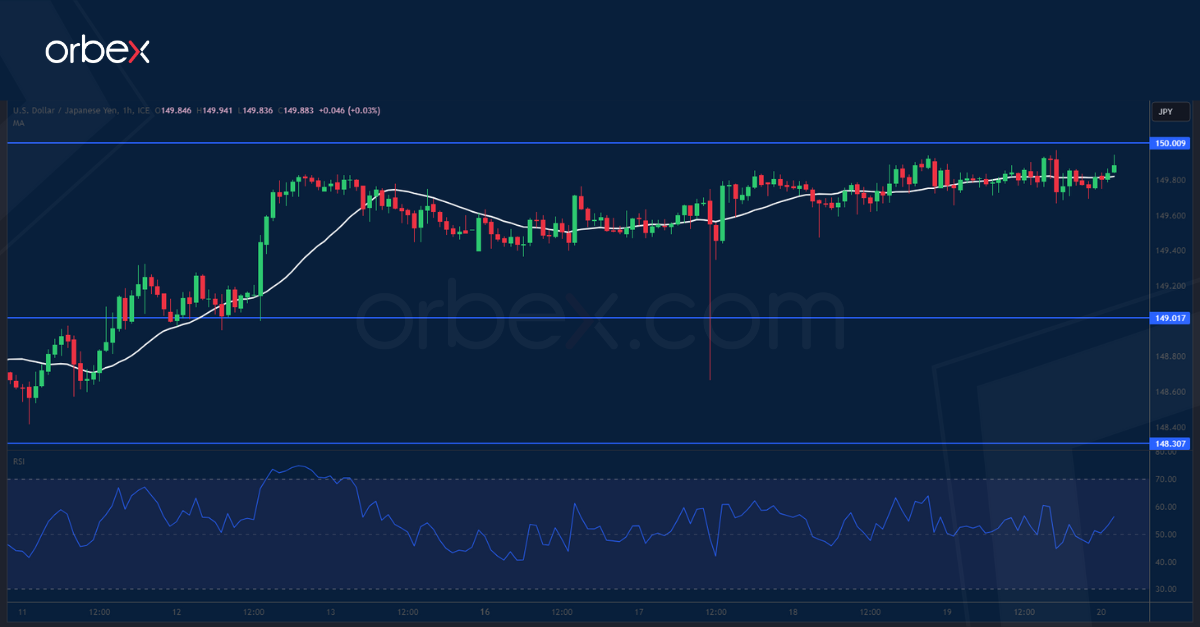
The Japanese yen extended losses after the CPI showed a cooldown in September. On the daily chart, the price is crawling back to its 12-month high of 152.00 as the bulls area tread cautiously in this sensitive apply zone. In the near term, the psychological level of 150.00 is a key resistance. A flash sell-off has forced some buyers to bail out but the long lower wick indicates a rejection of lower quotes. A close above 150.00 would release the tension and send the greenback to 151.00. 149.00 remains a key support on the downside.
AUDUSD drifts lower

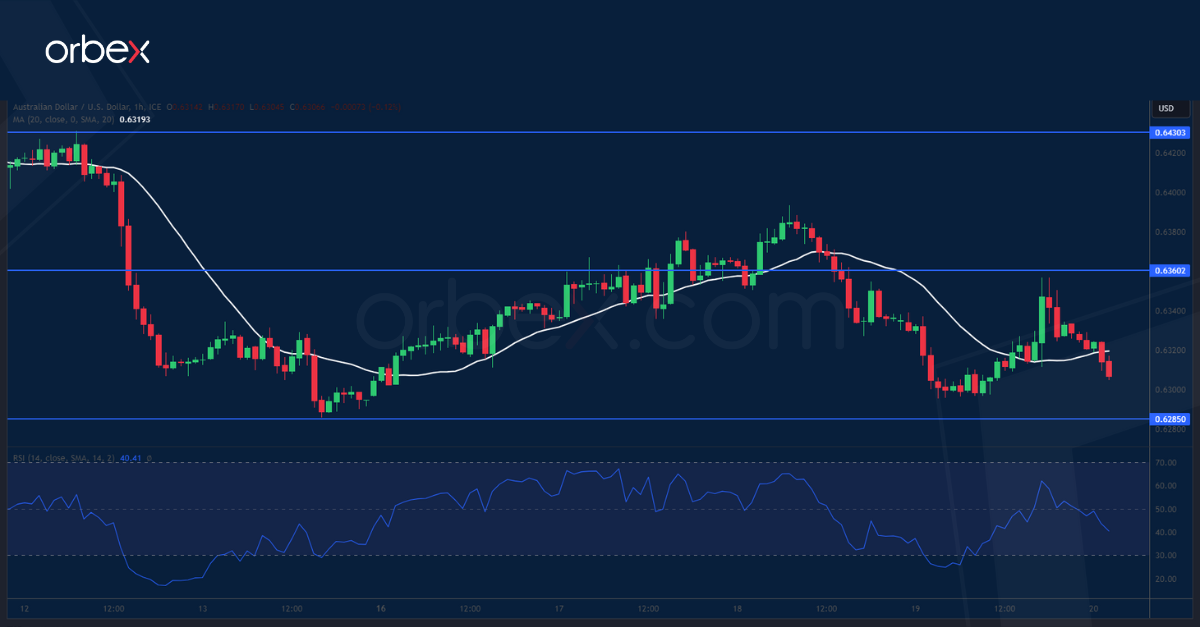
The Australian dollar softened after the labour data fell short of expectations in September. Sentiment remains weak after the bounce turned south at 0.6390 next to the 20-day SMA, suggesting the bears have been eager to sell into strength. The recent double bottom of 0.6285 is buyers’ last line of defence and its breach would trigger a new round of liquidation and open the door to a 12-month low at 0.6180. On the upside, 0.6360 is the first resistance and only a break above 0.6430 would initiate a meaningful recovery.
UK 100 struggles for support
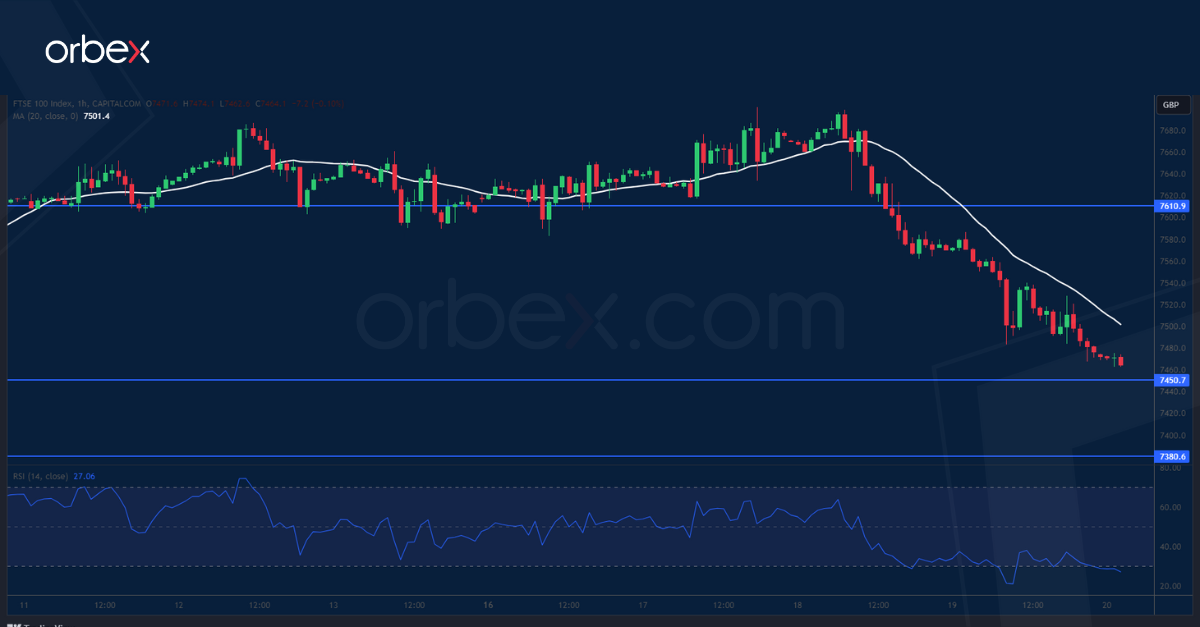
The FTSE tumbled as the UK’s gilt yields rose amid widespread risk aversion. A steep drop below 7590 has forced the latest buyers to liquidate their positions, denting the short-term bullish mood. As the RSI goes oversold, 7450 is the next level to see if buying interests would reemerge. The support-turned-resistance of 7610 would be the first hurdle to clear in case of a bounce. Further down, the double bottom of 7380 from the daily chart is a critical support to keep the index from sinking into a bearish reversal.

![Credit Card 160×600 [EN]](https://assets.iorbex.com/blog/wp-content/uploads/2023/06/13144507/Blog-Banner_EN-Banner_160X600X2.webp)