
GBPUSD hits resistance
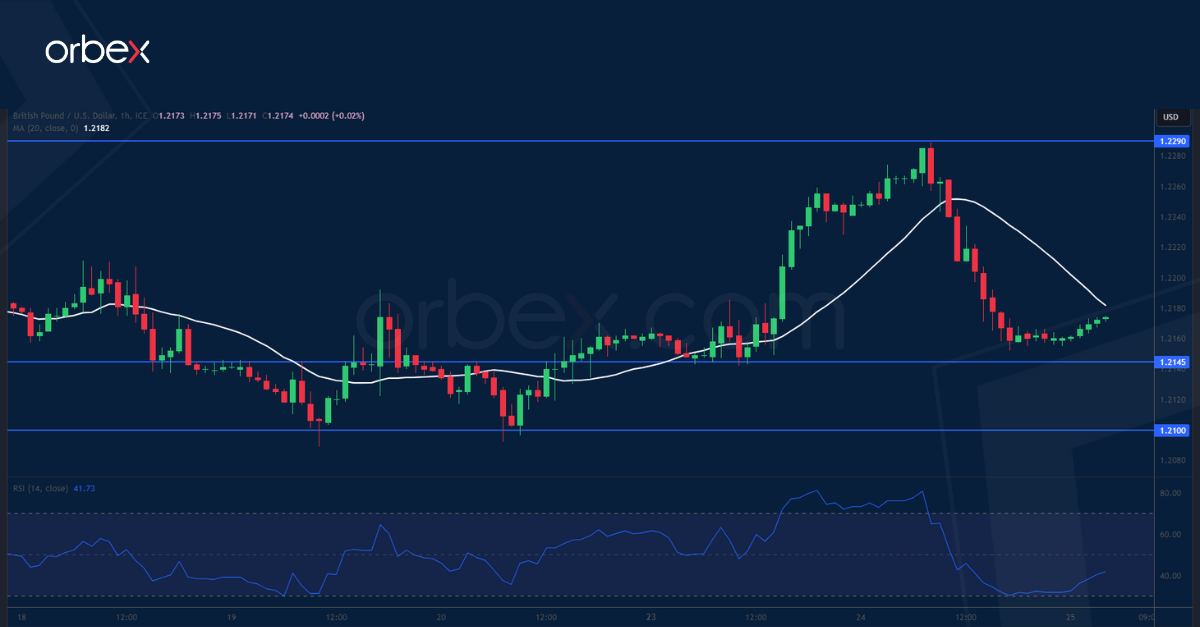
The pound saw some support from better-than-expected job data in September. A jump above the first hurdle of 1.2220 has prompted sellers to cover some of their bets. The supply zone 1.2290-1.2330 at the recent high may see stiff selling pressure as it might be their last stronghold. A bullish breakout could trigger momentum buying and send cable to 1.2500. 1.2145 at the origin of the latest impetus is the first real test of buyers’ commitment and further down 1.2100 an important floor to keep this month’s rebound valid.
AUDUSD breaks higher

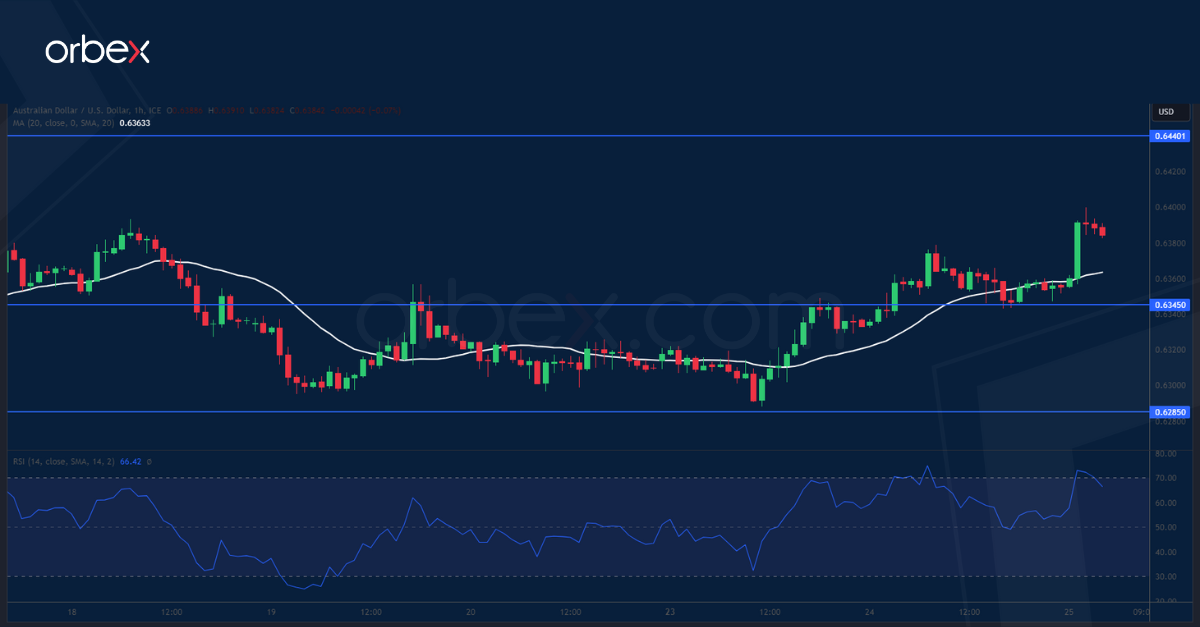
The Australian dollar climbed after the CPI beat estimates in the third quarter. The pair bounced back after forming a triple bottom at 0.6285 at last November’s low. A breach above 0.6390 at the top of a previous swing high could lift offers to the daily resistance of 0.6440 where another breakout would pave the way for a bullish reversal above 0.6500 in the medium-term. As the RSI inches into overbought territory once again, 0.6345 at the base of the latest momentum is the immediate level to expect follow-up interests.
XAUUSD seeks support
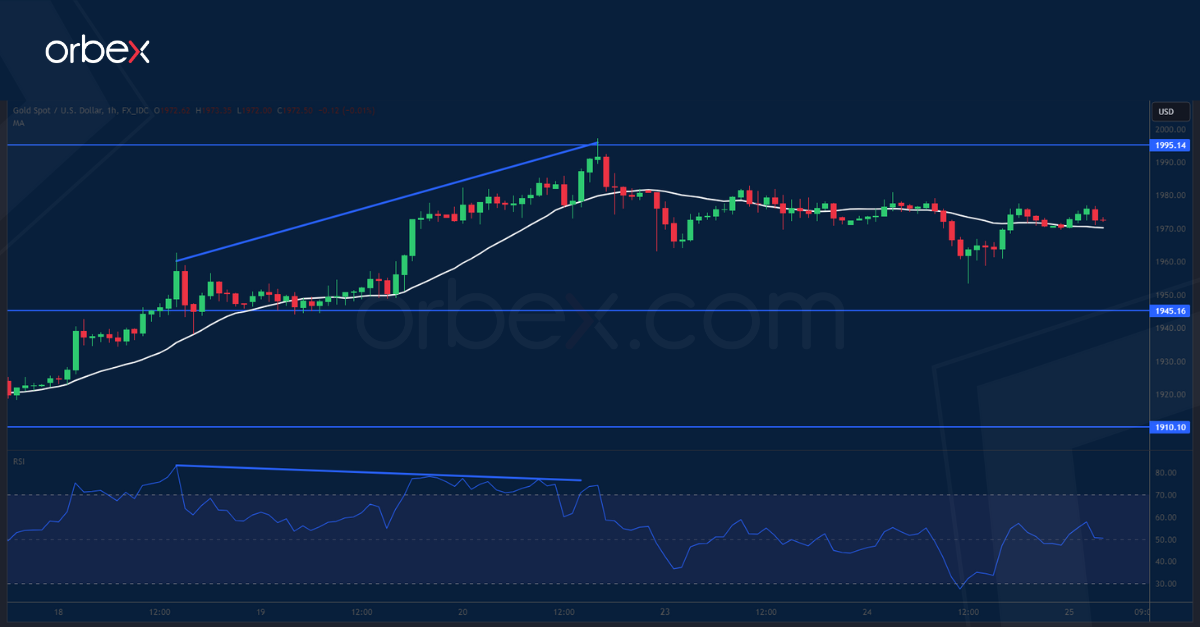
Gold slipped as the US dollar advanced across the board against major currencies. A surge above last July’s peak of 1985 has forced the bears to close out, giving the opposite side a fighting chance after five months’ of correction. The supply area around 1995 at the start of a sell-off back in May is an important level to clear to signal a bullish continuation. In the near term, a bearish RSI divergence suggests a deceleration in the rally and could lead to a pullback if intraday buyers take profit. 1945 would be the first support.

![Credit Card 160×600 [EN]](https://assets.iorbex.com/blog/wp-content/uploads/2023/06/13144507/Blog-Banner_EN-Banner_160X600X2.webp)