
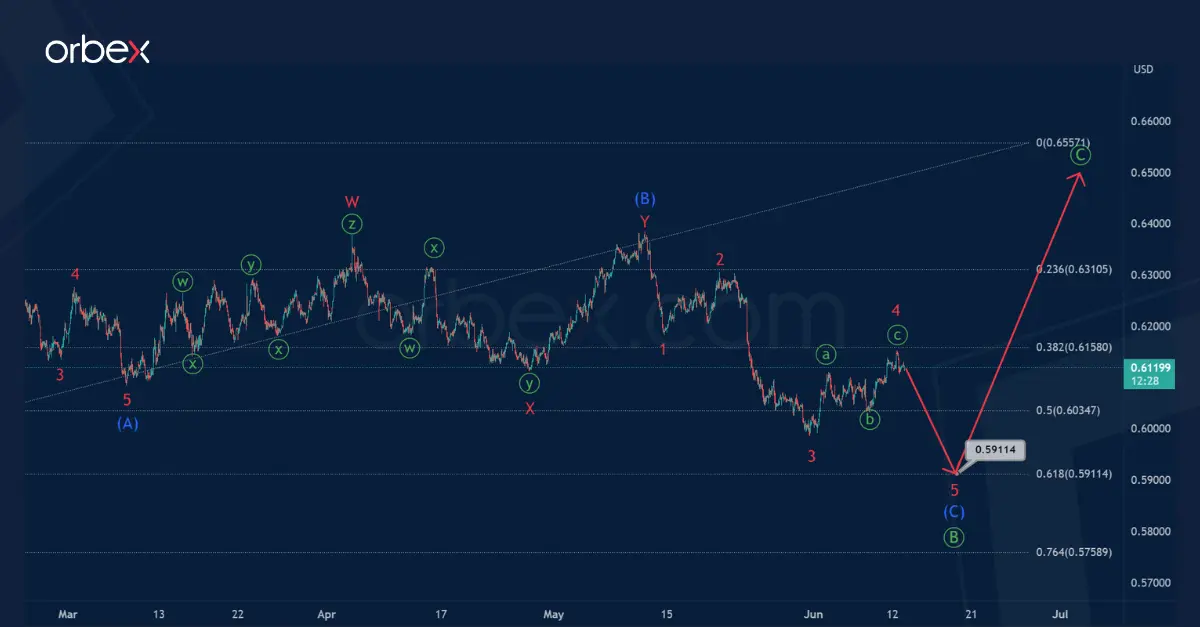
The NZDUSD pair is currently building a correction pattern. We can see a zigzag consisting of primary waves Ⓐ-Ⓑ-Ⓒ.
The bearish correction Ⓑ is currently under development, its structure is similar to the standard zigzag (A)-(B)-(C). The impulse (A) and correction (B) have ended, with the latter being a minor double zigzag W-X-Y.
The pair moves down in an intermediate impulse (C) consisting of sub-waves 1-2-3-4-5, approximately to 0.591. At that level, primary correction Ⓑ will be at 61.8% of actionary wave Ⓐ.

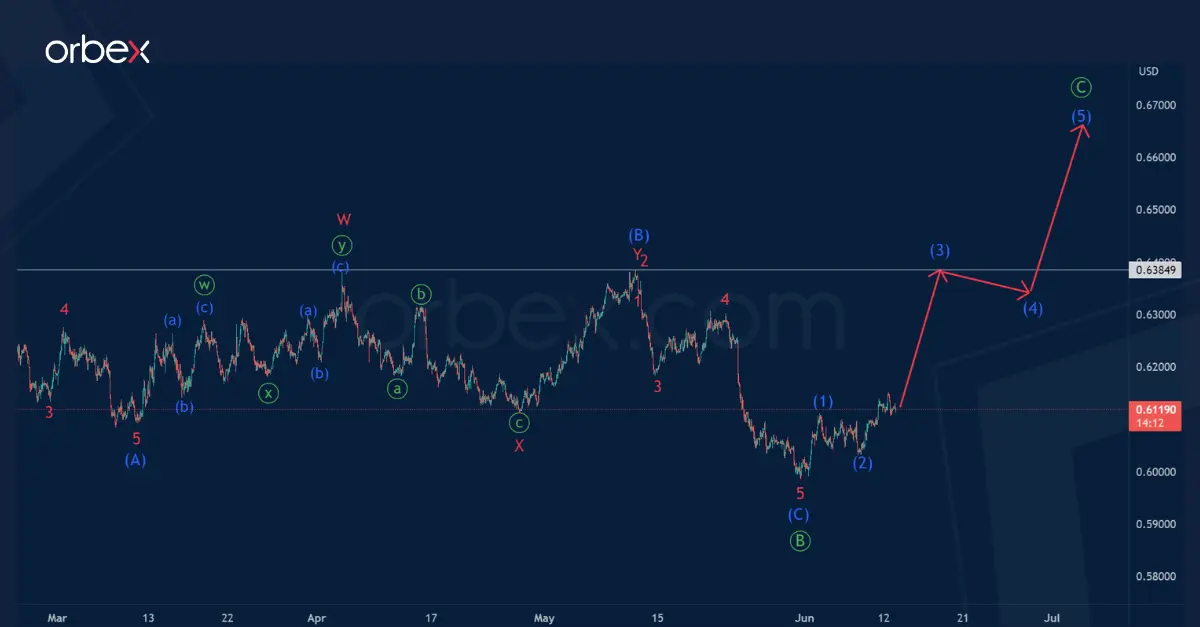
Let’s assume a variant where the primary correction Ⓑ is fully formed. It is a standard intermediate zigzag (A)-(B)-(C).
Thus, in the last section of the chart, we can observe the beginning of the development of the primary wave Ⓒ. If this scenario is confirmed, we will see the development of a bullish trend.
The first target is a maximum of 0.638, where the minor sub-waves W and Y were completed.

