
EURUSD probes support
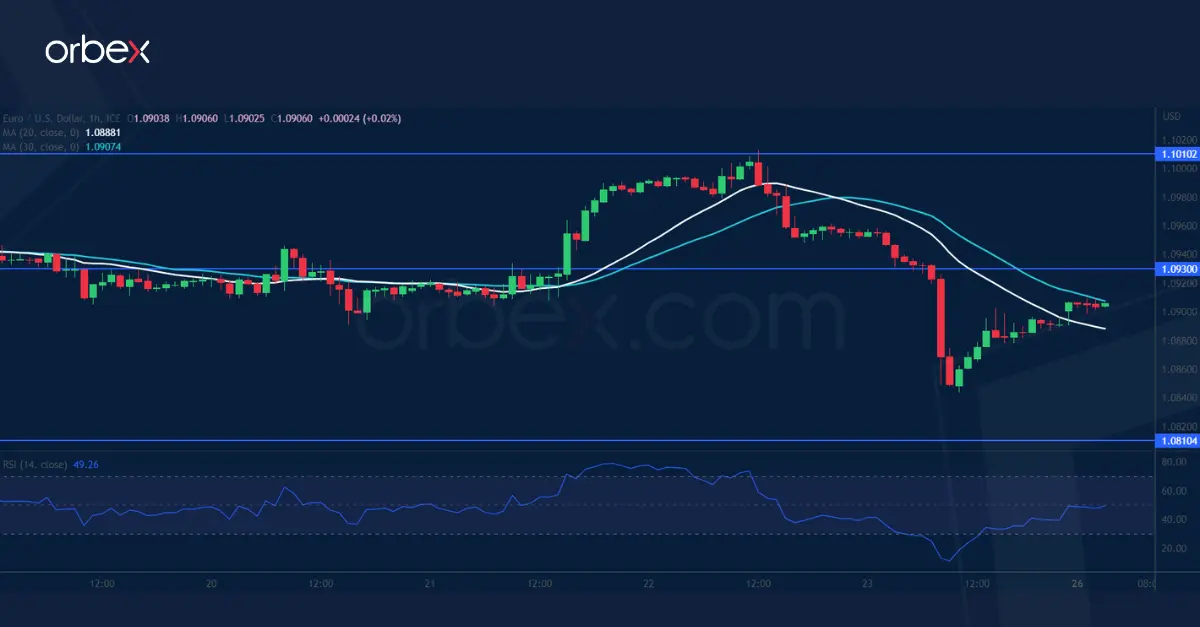
The euro fell after lacklustre PMI showed a manufacturing recession. The rally first came to a halt in the supply zone around 1.1010 from the early May sell-off and a subsequent tumble below 1.0900 indicates a lack of follow-through bids, prompting more buyers to close their positions. 1.0810 on the bullish MA cross on the daily chart is a major level to gauge the bulls’ commitment. A close above the fresh resistance of 1.0930 is necessary to ease the selling pressure. Otherwise, a correction might send the euro to 1.0700.
XAGUSD struggles to recover

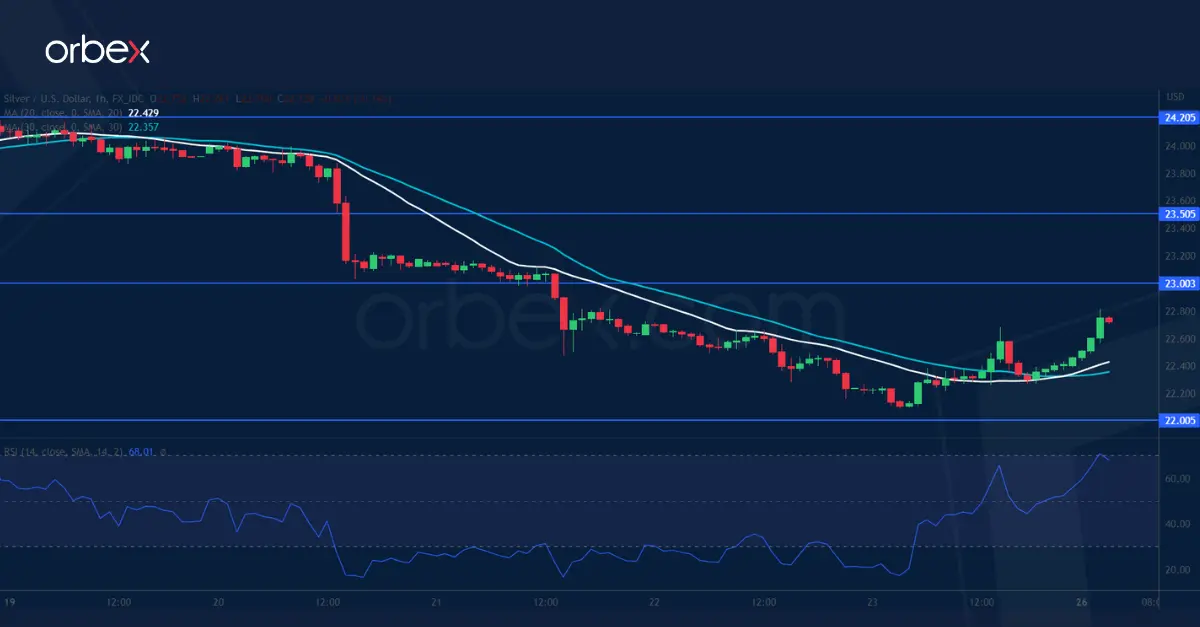
Silver slips in the wake of hawkish comments by Fed officials. The precious metal continues lower after it invalidated this month’s rebound by breaking below the daily support of 22.70. The round number of 22.00 is a key level where buying interests have shown up again as the RSI rises back from the oversold area. 23.00 from the previous demand zone is a key resistance where the bears could be eager to fade a rebound after sentiment turned downbeat. 23.45 would be a second layer of resistance in case of a breakout.
GER 40 grinds key support
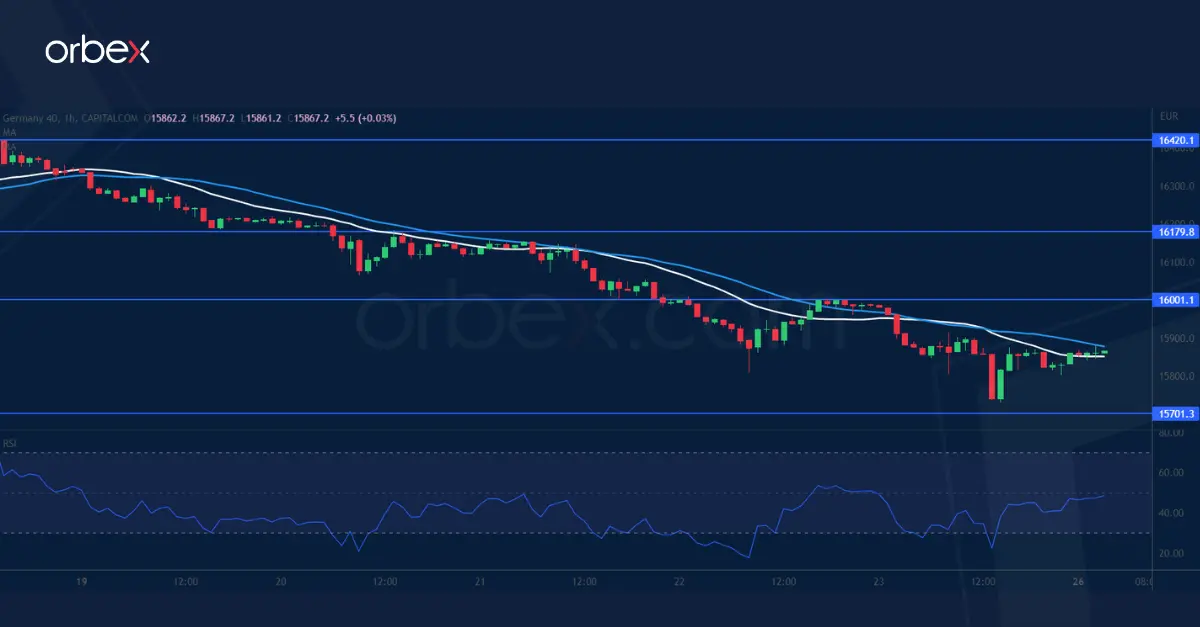
The Dax 40 weakens over concerns of protracted tightening cycles by major central banks. A break below the lower band (15900) of a previous consolidation range has dented the market mood. Then a brief bounce came under pressure at the psychological level of 16000, which is a sign of a strong bearish cap. The daily support of 15700 at the base of the June rally is a critical floor to keep the index afloat as its breach could trigger a correction towards 15200. 16000 is the first hurdle to lift to help the bulls regain confidence.

![Credit Card 160×600 [EN]](https://assets.iorbex.com/blog/wp-content/uploads/2023/06/13144507/Blog-Banner_EN-Banner_160X600X2.webp)