
In the long term, BABA is forming a bearish trend, or rather a triple cycle zigzag.
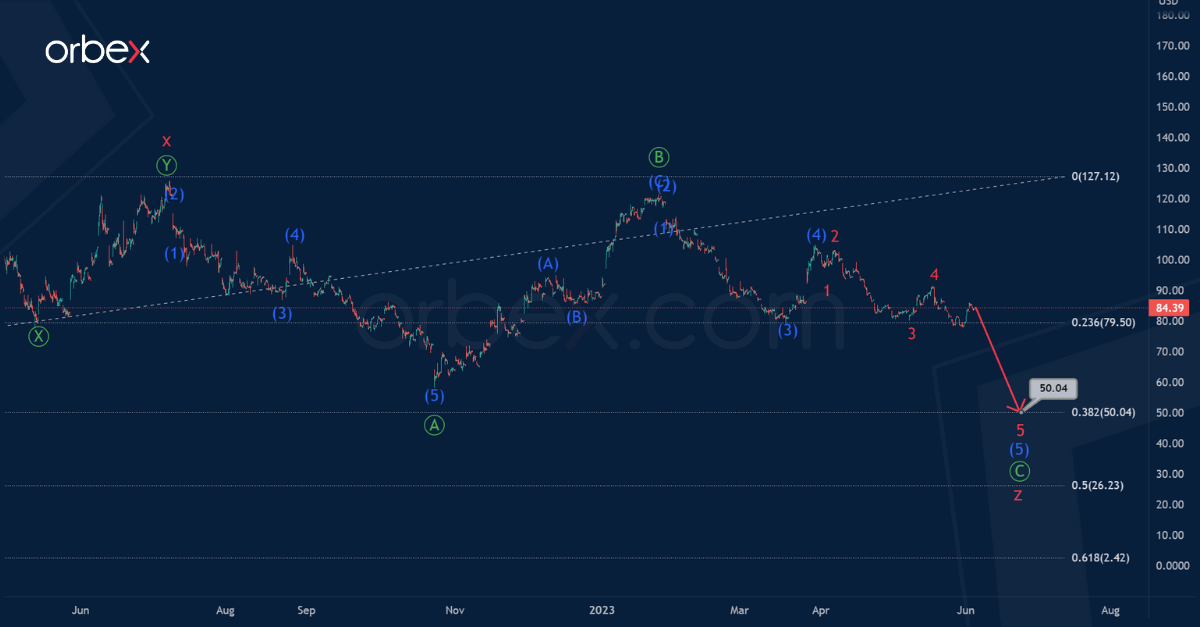
The current chart of the 1H timeframe shows the final part of the second intervening wave x. At the moment, we are seeing the formation of the final actionary wave z. This wave looks to be forming a primary zigzag Ⓐ-Ⓑ-Ⓒ.
It seems that the primary impulse Ⓐ and the correction Ⓑ have ended. Therefore, in the near future we can expect a decrease to the level of 50.04 in the sub-wave Ⓒ, consisting of sub-waves (1)-(2)-(3)-(4)-(5).

At the specified mark, wave z will be at 38.2% of wave y.
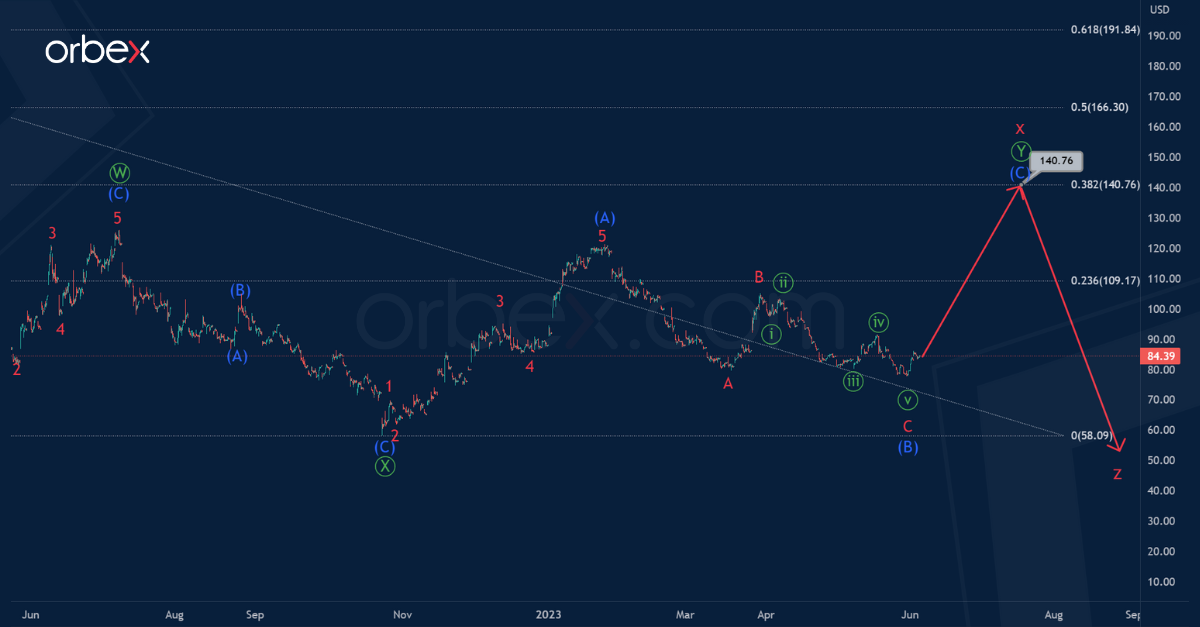
Alternatively, it is considered that the intervening wave x continues with a complex internal structure. Within the intervening wave x, the primary sub-waves Ⓦ-Ⓧ are completed.
Now the price is moving inside the wave Ⓨ, which could take a zigzag structure (A)-(B)-(C). There is a possibility that the construction of a bearish intermediate correction (B) has ended. Therefore, prices could soon impulsively move in wave (C) in the direction of 140.76.
At the specified level, intervening wave x will be at 38.2% along the Fibonacci lines of actionary wave y.

![Credit Card 160×600 [EN]](https://assets.iorbex.com/blog/wp-content/uploads/2023/06/13144507/Blog-Banner_EN-Banner_160X600X2.webp)