
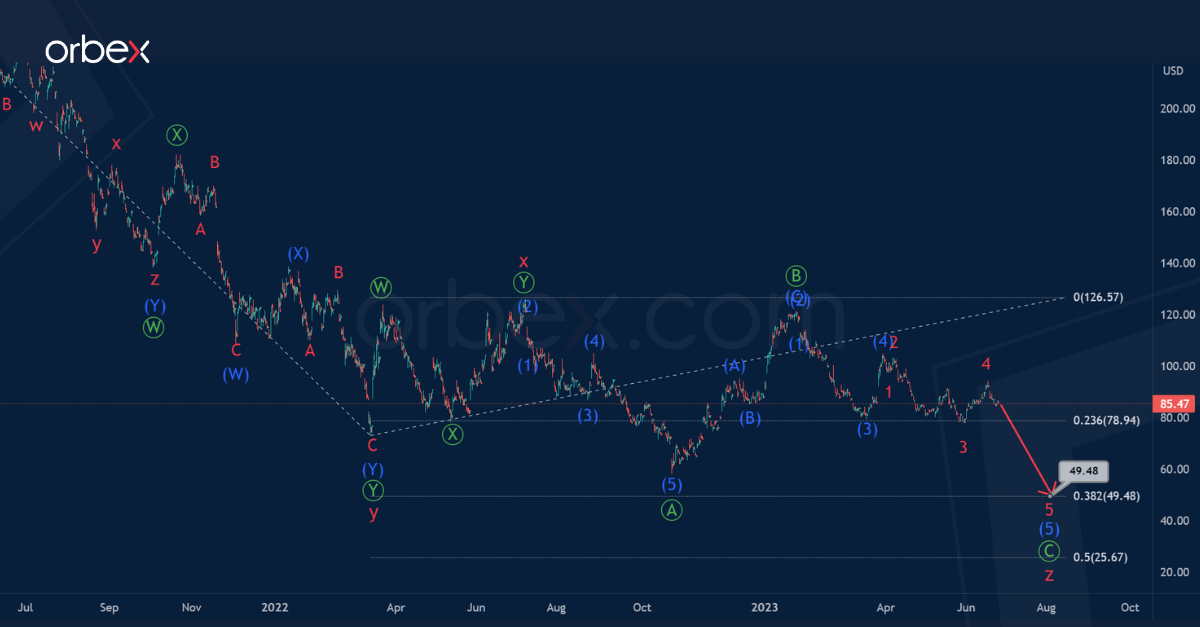
In the long term, BABA stock is building a bearish triple zigzag w-x-y-x-z of the cycle degree.
On the current chart we see the final part of the actionary wave y and the second intervening wave x. Now the formation of the final actionary wave z is taking place. This will most likely take the form of a primary zigzag Ⓐ-Ⓑ-Ⓒ.

The first impulse Ⓐ and the correction Ⓑ are fully completed. In the near future, we can expect a decline to 49.48 in the sub-wave Ⓒ, consisting of sub-waves (1)-(2)-(3)-(4)-(5).
At the specified mark, wave z will be at 38.2% of wave y.
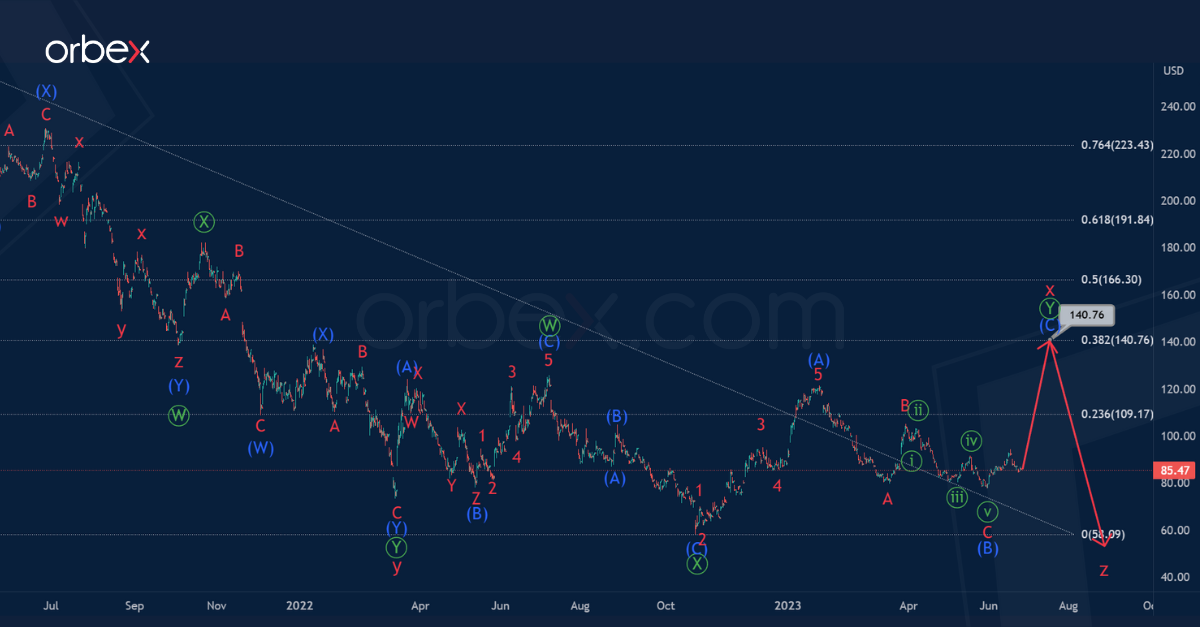
Let’s consider the second scenario, where the intervening wave x continues, having a complex internal structure. In the intervening wave x, the primary sub-waves Ⓦ-Ⓧ have ended.
The actionary leg Ⓨ is under development, which could take a zigzag structure (A)-(B)-(C). There is a possibility that the construction of a bearish intermediate correction (B) has come to the end. So in the near future, the price could impulsively start moving in wave (C) in the direction of 140.76.
At the specified level, intervening wave x will be at 38.2% along the Fibonacci lines of actionary wave y.

![Credit Card 160×600 [EN]](https://assets.iorbex.com/blog/wp-content/uploads/2023/06/13144507/Blog-Banner_EN-Banner_160X600X2.webp)