
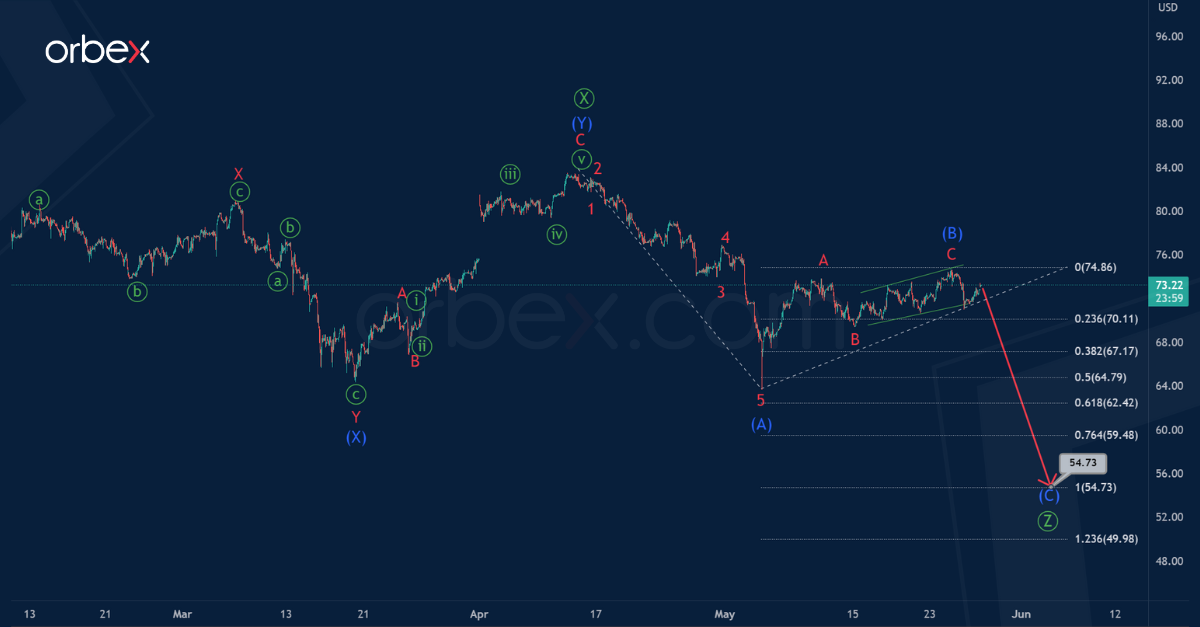
We considered the USOIL situation more than three weeks ago. We see that the formation of a large bearish trend continues, taking the form of a triple zigzag Ⓦ-Ⓧ-Ⓨ-Ⓧ-Ⓩ.
It seems that the final sub-wave Ⓩ of this triple zigzag is being built. It is possible that the primary wave Ⓩ will have the form of a simple zigzag (A)-(B)-(C) of the intermediate degree.
The intermediate impulse wave (A) and the zigzag correction (B) look completed. Thus, in the near future, the price could fall in the sub-wave (C).

Wave (C) is likely to strive for equality with impulse (A), so its end is expected near 54.73.
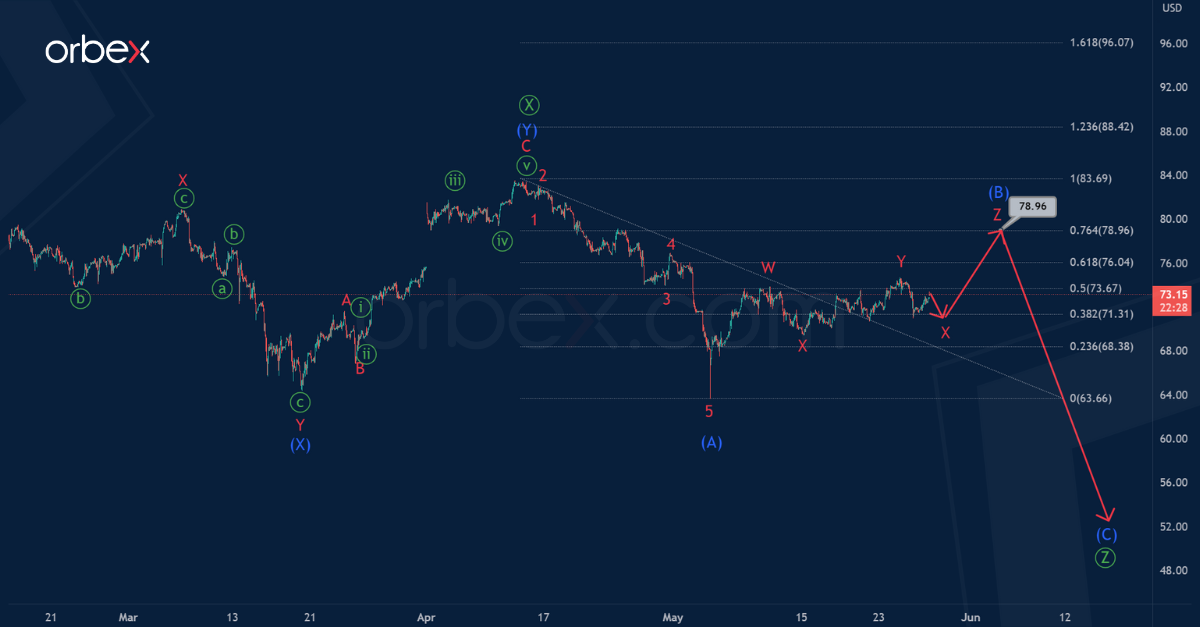
Let’s consider an alternative scenario in which the correction wave (B) can take on a more complex internal structure.
Perhaps, with a bullish movement, we will see how the correction (B) ends in the form of a triple zigzag W-X-Y-X-Z. Now we can notice the completed W-X-Y sub-waves.
In the near future, the development of minor sub-waves X-Y is expected, as shown in the chart, approximately near 78.96.
At that level, correction (B) will be at 76.4% of impulse (A).

