
We talked about BABA shares about a month ago where a bearish trend was forming.
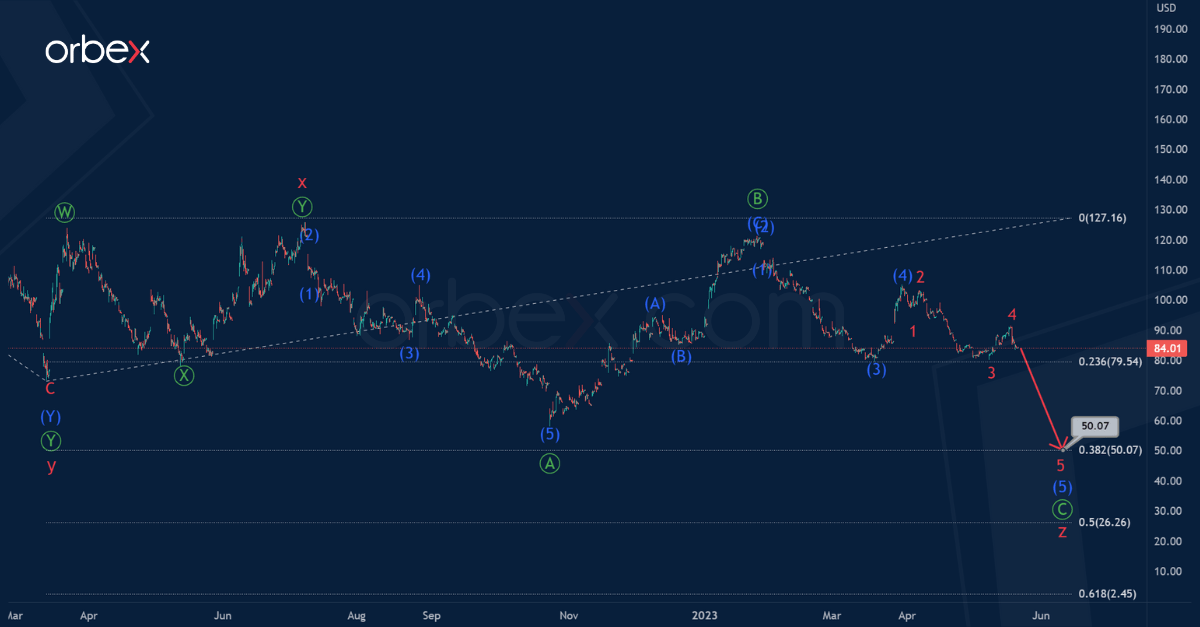
The current chart shows the final part of the completed actionary wave y and the second intervening wave x. These waves are double zigzags. At the moment we are seeing the formation of the final actionary wave z. This will take the form of a primary zigzag Ⓐ-Ⓑ-Ⓒ.
There is a high probability that the primary impulse Ⓐ and the correction Ⓑ have ended. So we can expect a decline to 50.07 in the sub-wave Ⓒ consisting of sub-waves (1)-(2)-(3)-(4)-(5).

At the specified mark, wave z will be at 38.2% of wave y.
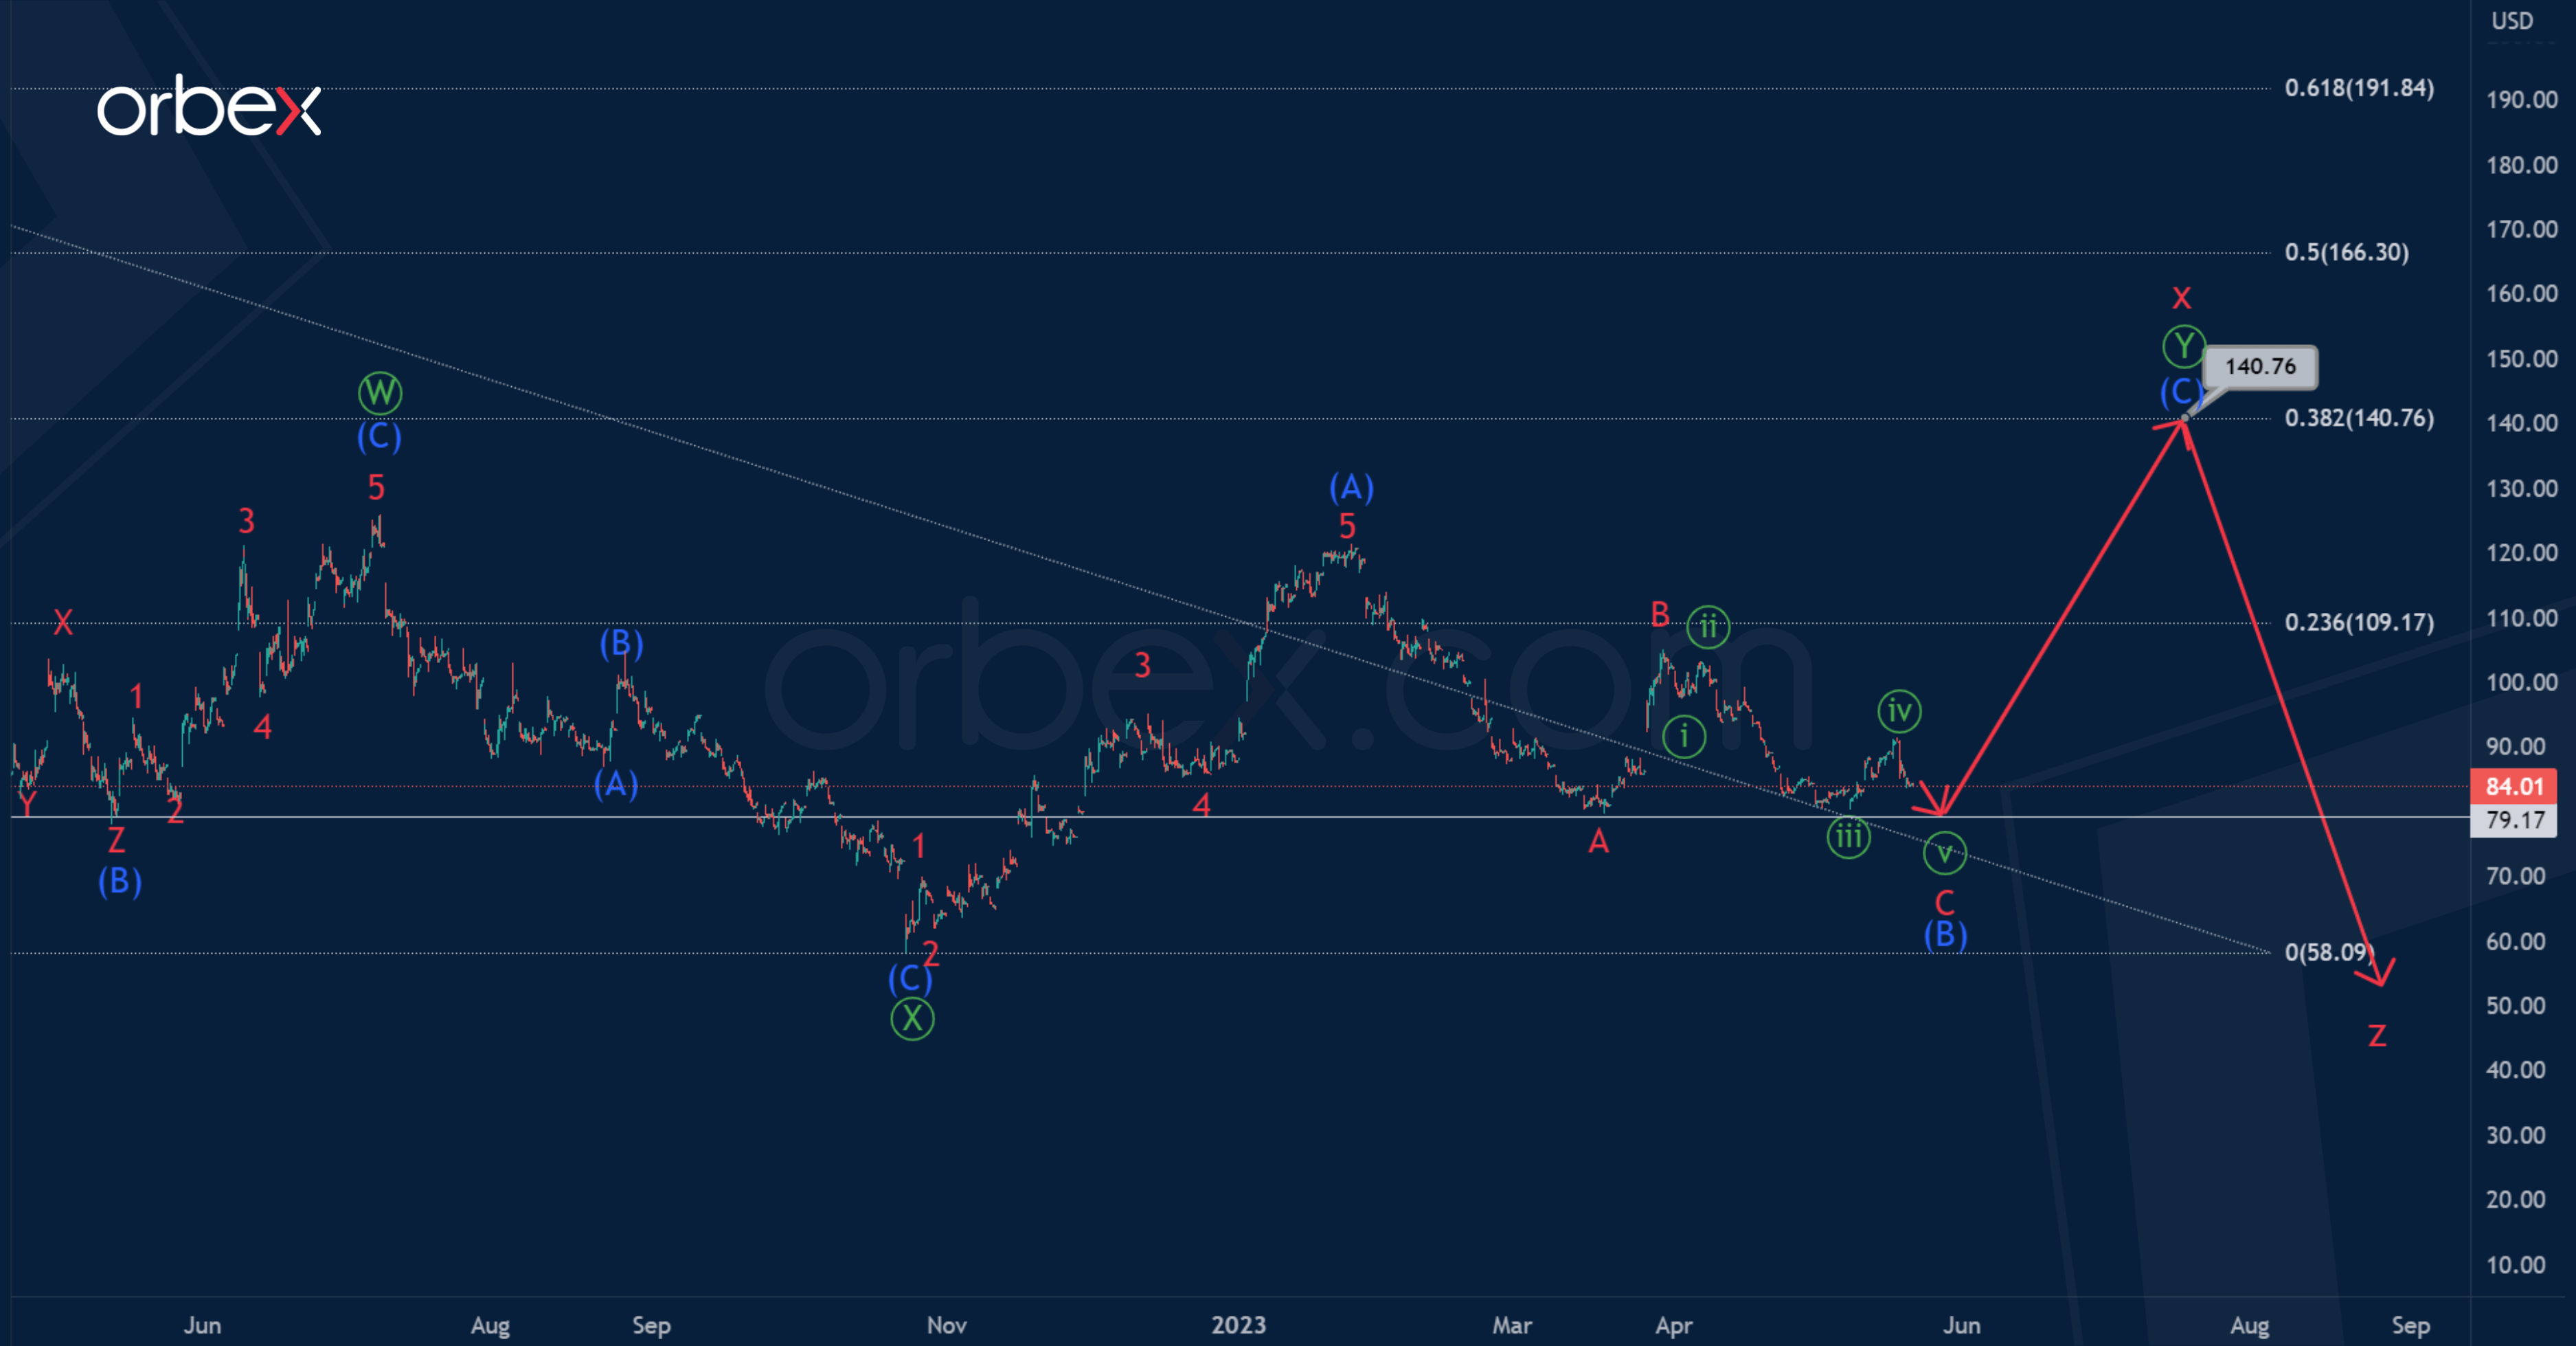
Alternatively, the intervening wave x has a more complex internal structure. Within the intervening wave x, only the first two zigzag sub-waves Ⓦ-Ⓧ are completed.
At the moment, prices are in wave Ⓨ. This could take a zigzag structure (A)-(B)-(C) of the intermediate degree.
Most likely, we are approaching the price of 79.17 where the correction wave (B) could end. After which, the price could begin to rise in the potential impulse (C).
The price in the intermediate wave (C) is likely to rise to 140.76. At that level, cycle intervening wave x will be at 38.2% of actionary wave y.

![Credit Card 160×600 [EN]](https://assets.iorbex.com/blog/wp-content/uploads/2023/06/13144507/Blog-Banner_EN-Banner_160X600X2.webp)