
USDCHF grinds recent bottom
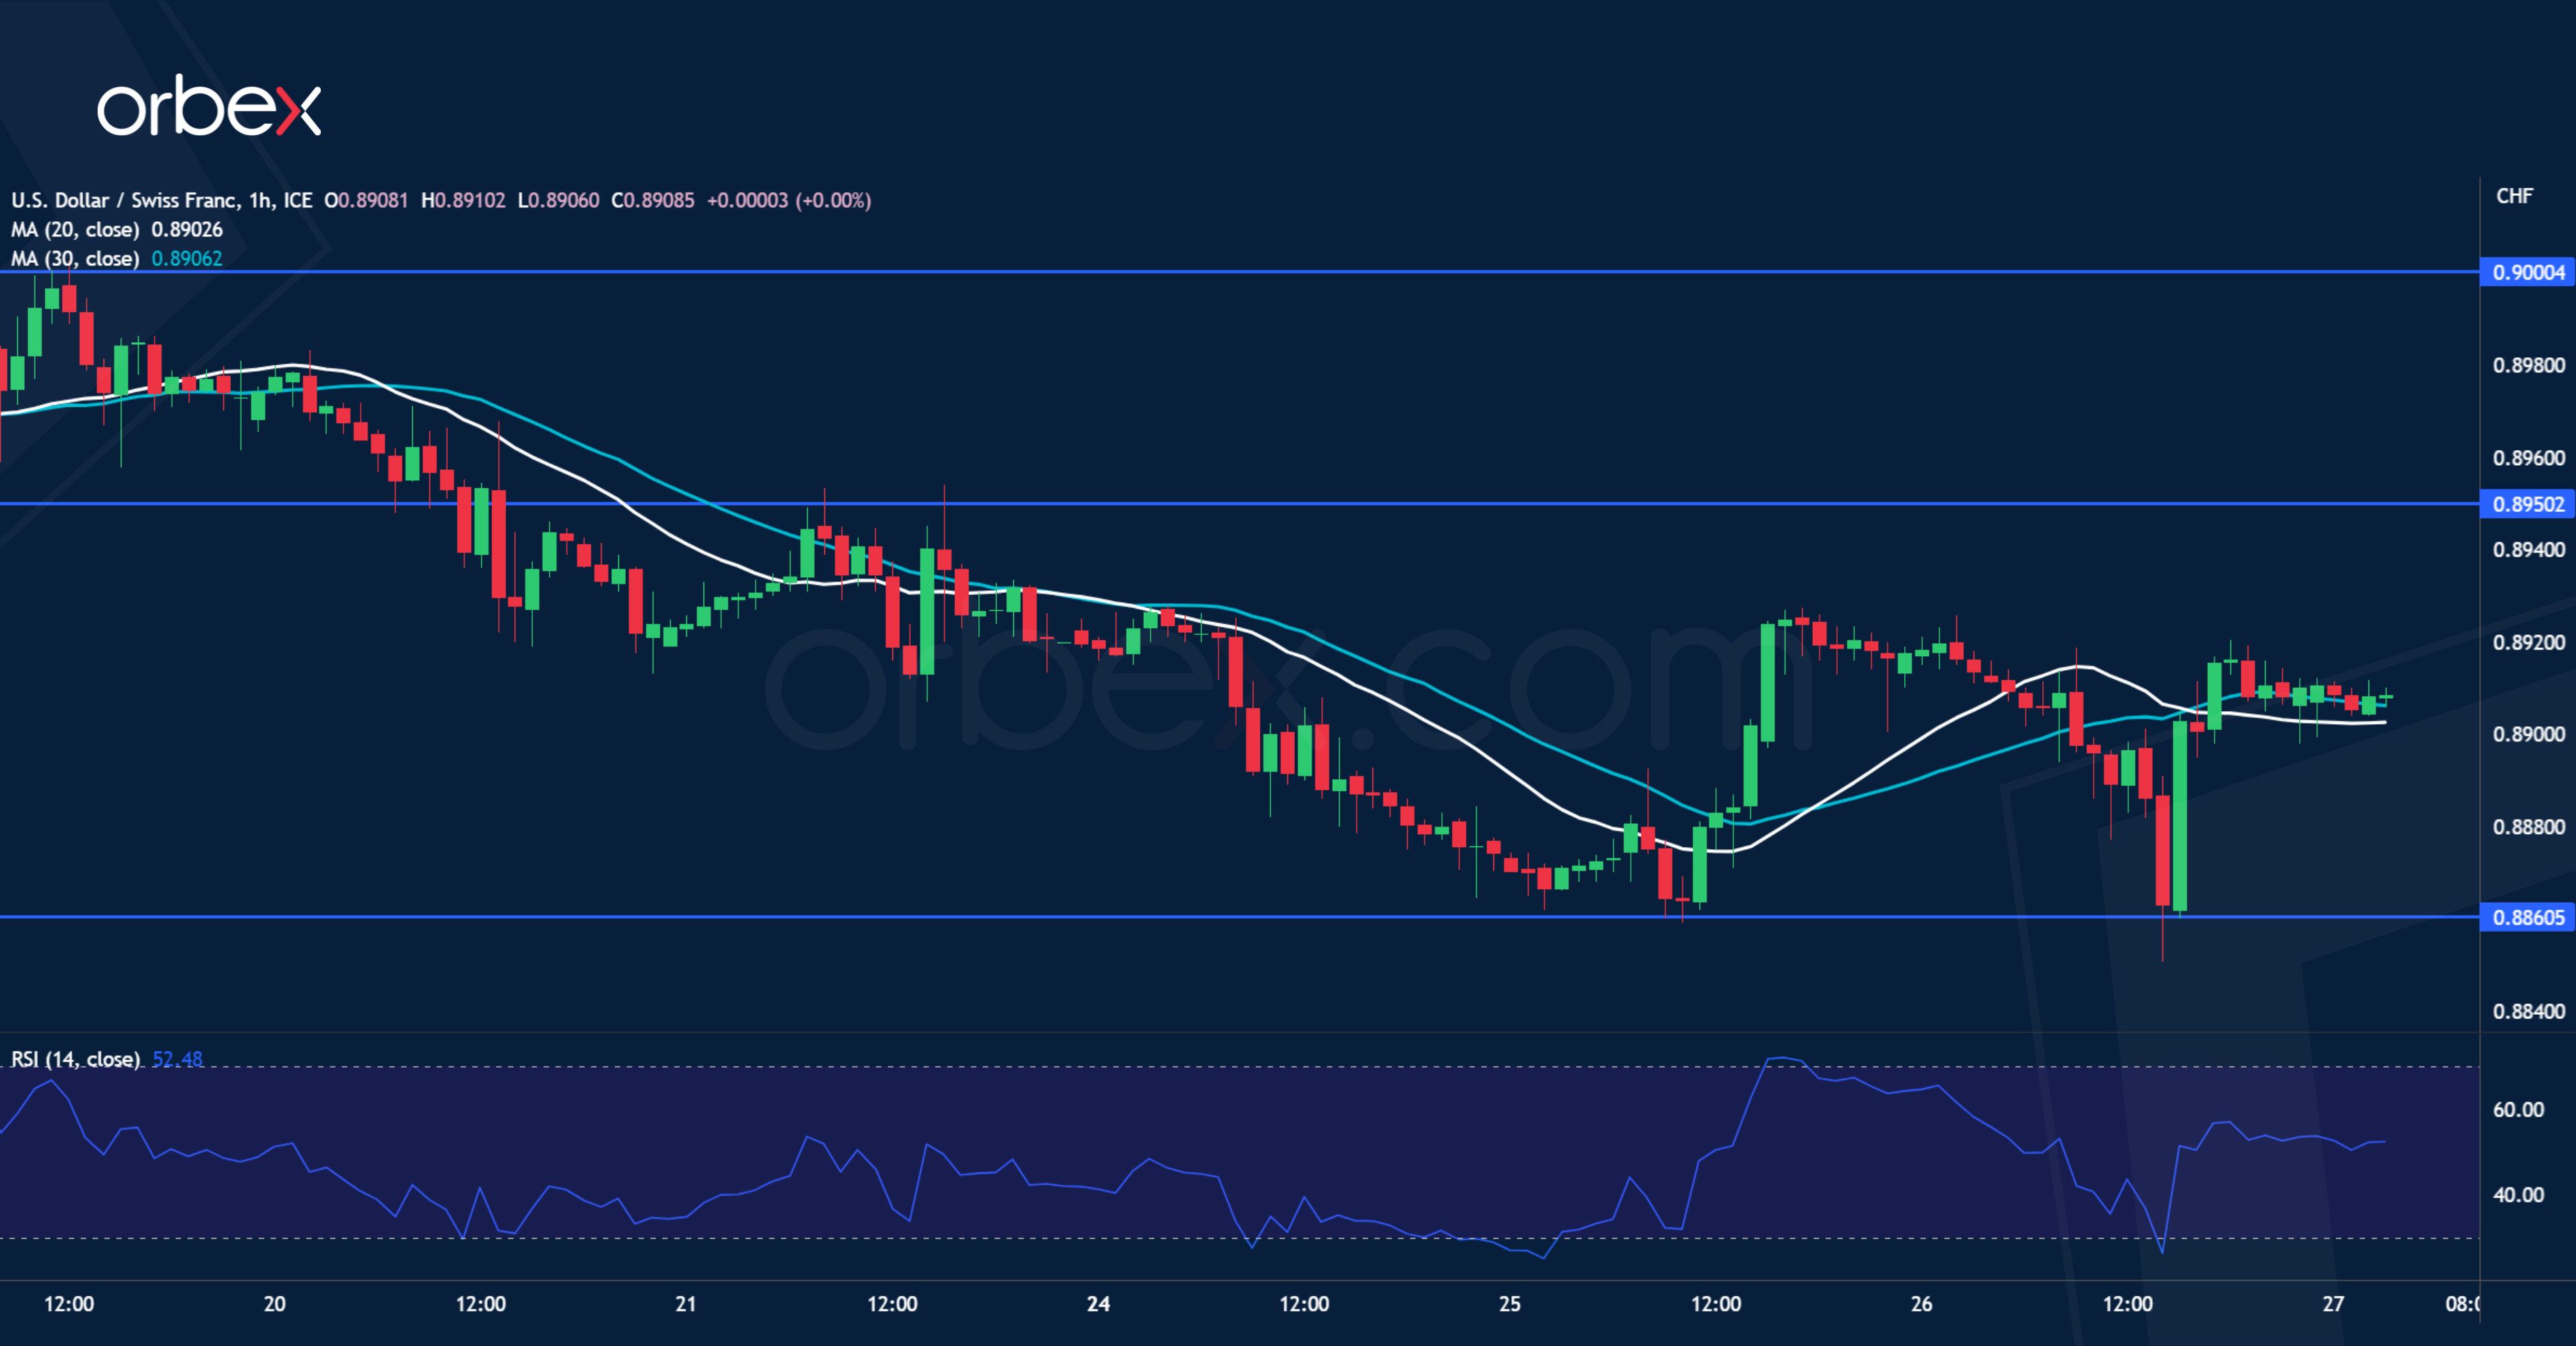
The US dollar struggles as lacklustre capital goods orders suggest an economic slowdown. The pair is in a precarious situation with tentative breaks below the recent bottom at 0.8860. The bears may see a rebound as an opportunity to sell into strength. 0.8950 is the closest resistance in this regard. Only a clean cut above the psychological level of 0.9000 would improve the market mood and add a building block to a reversal. Otherwise, momentum selling may take over again and send the greenback to January 2021’s low at 0.8760.
GBPUSD tests key resistance

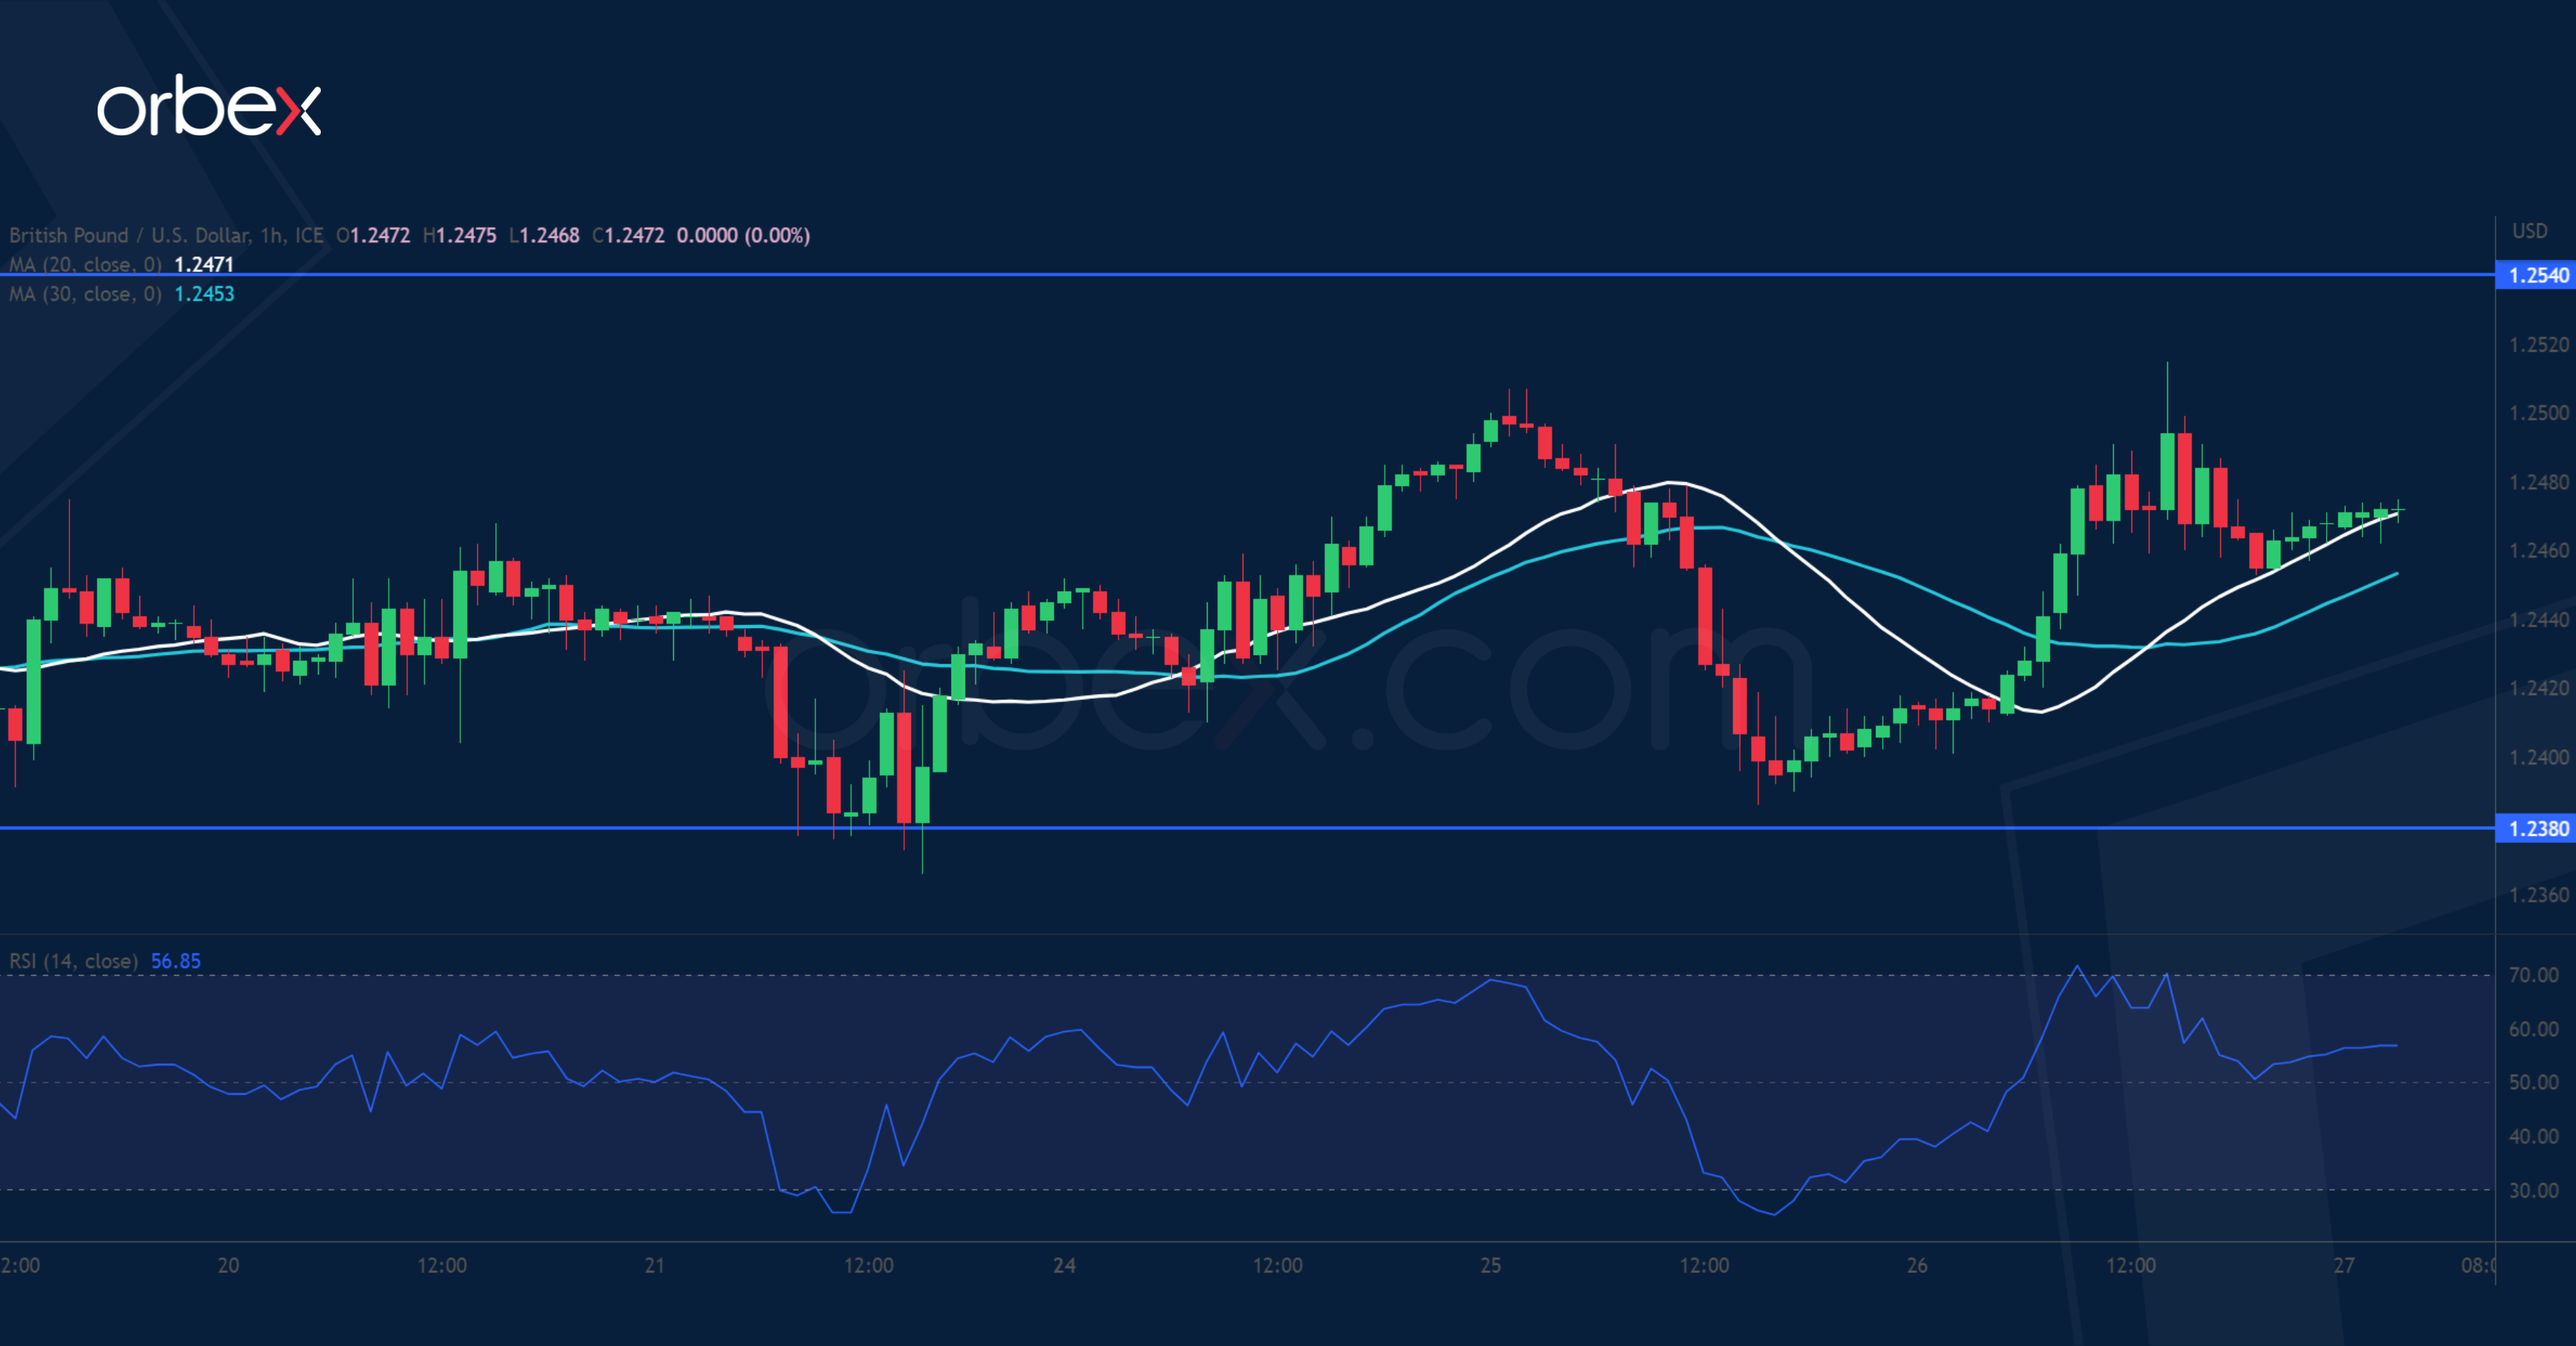
The pound bounces as traders reduce their demand for safe haven assets. On the daily chart, the price is consolidating its gains at the confluence of the supply-turned-demand zone and the 30-day SMA, which suggests that the bias remains bullish. After finding support over 1.2380, a close above the previous swing high of 1.2540 where strong resistance has been felt may flush out remaining selling interests and pave the way for a breakout rally towards 1.2600. The RSI’s overbought condition may temporarily limit the upside.
USOIL struggles for support
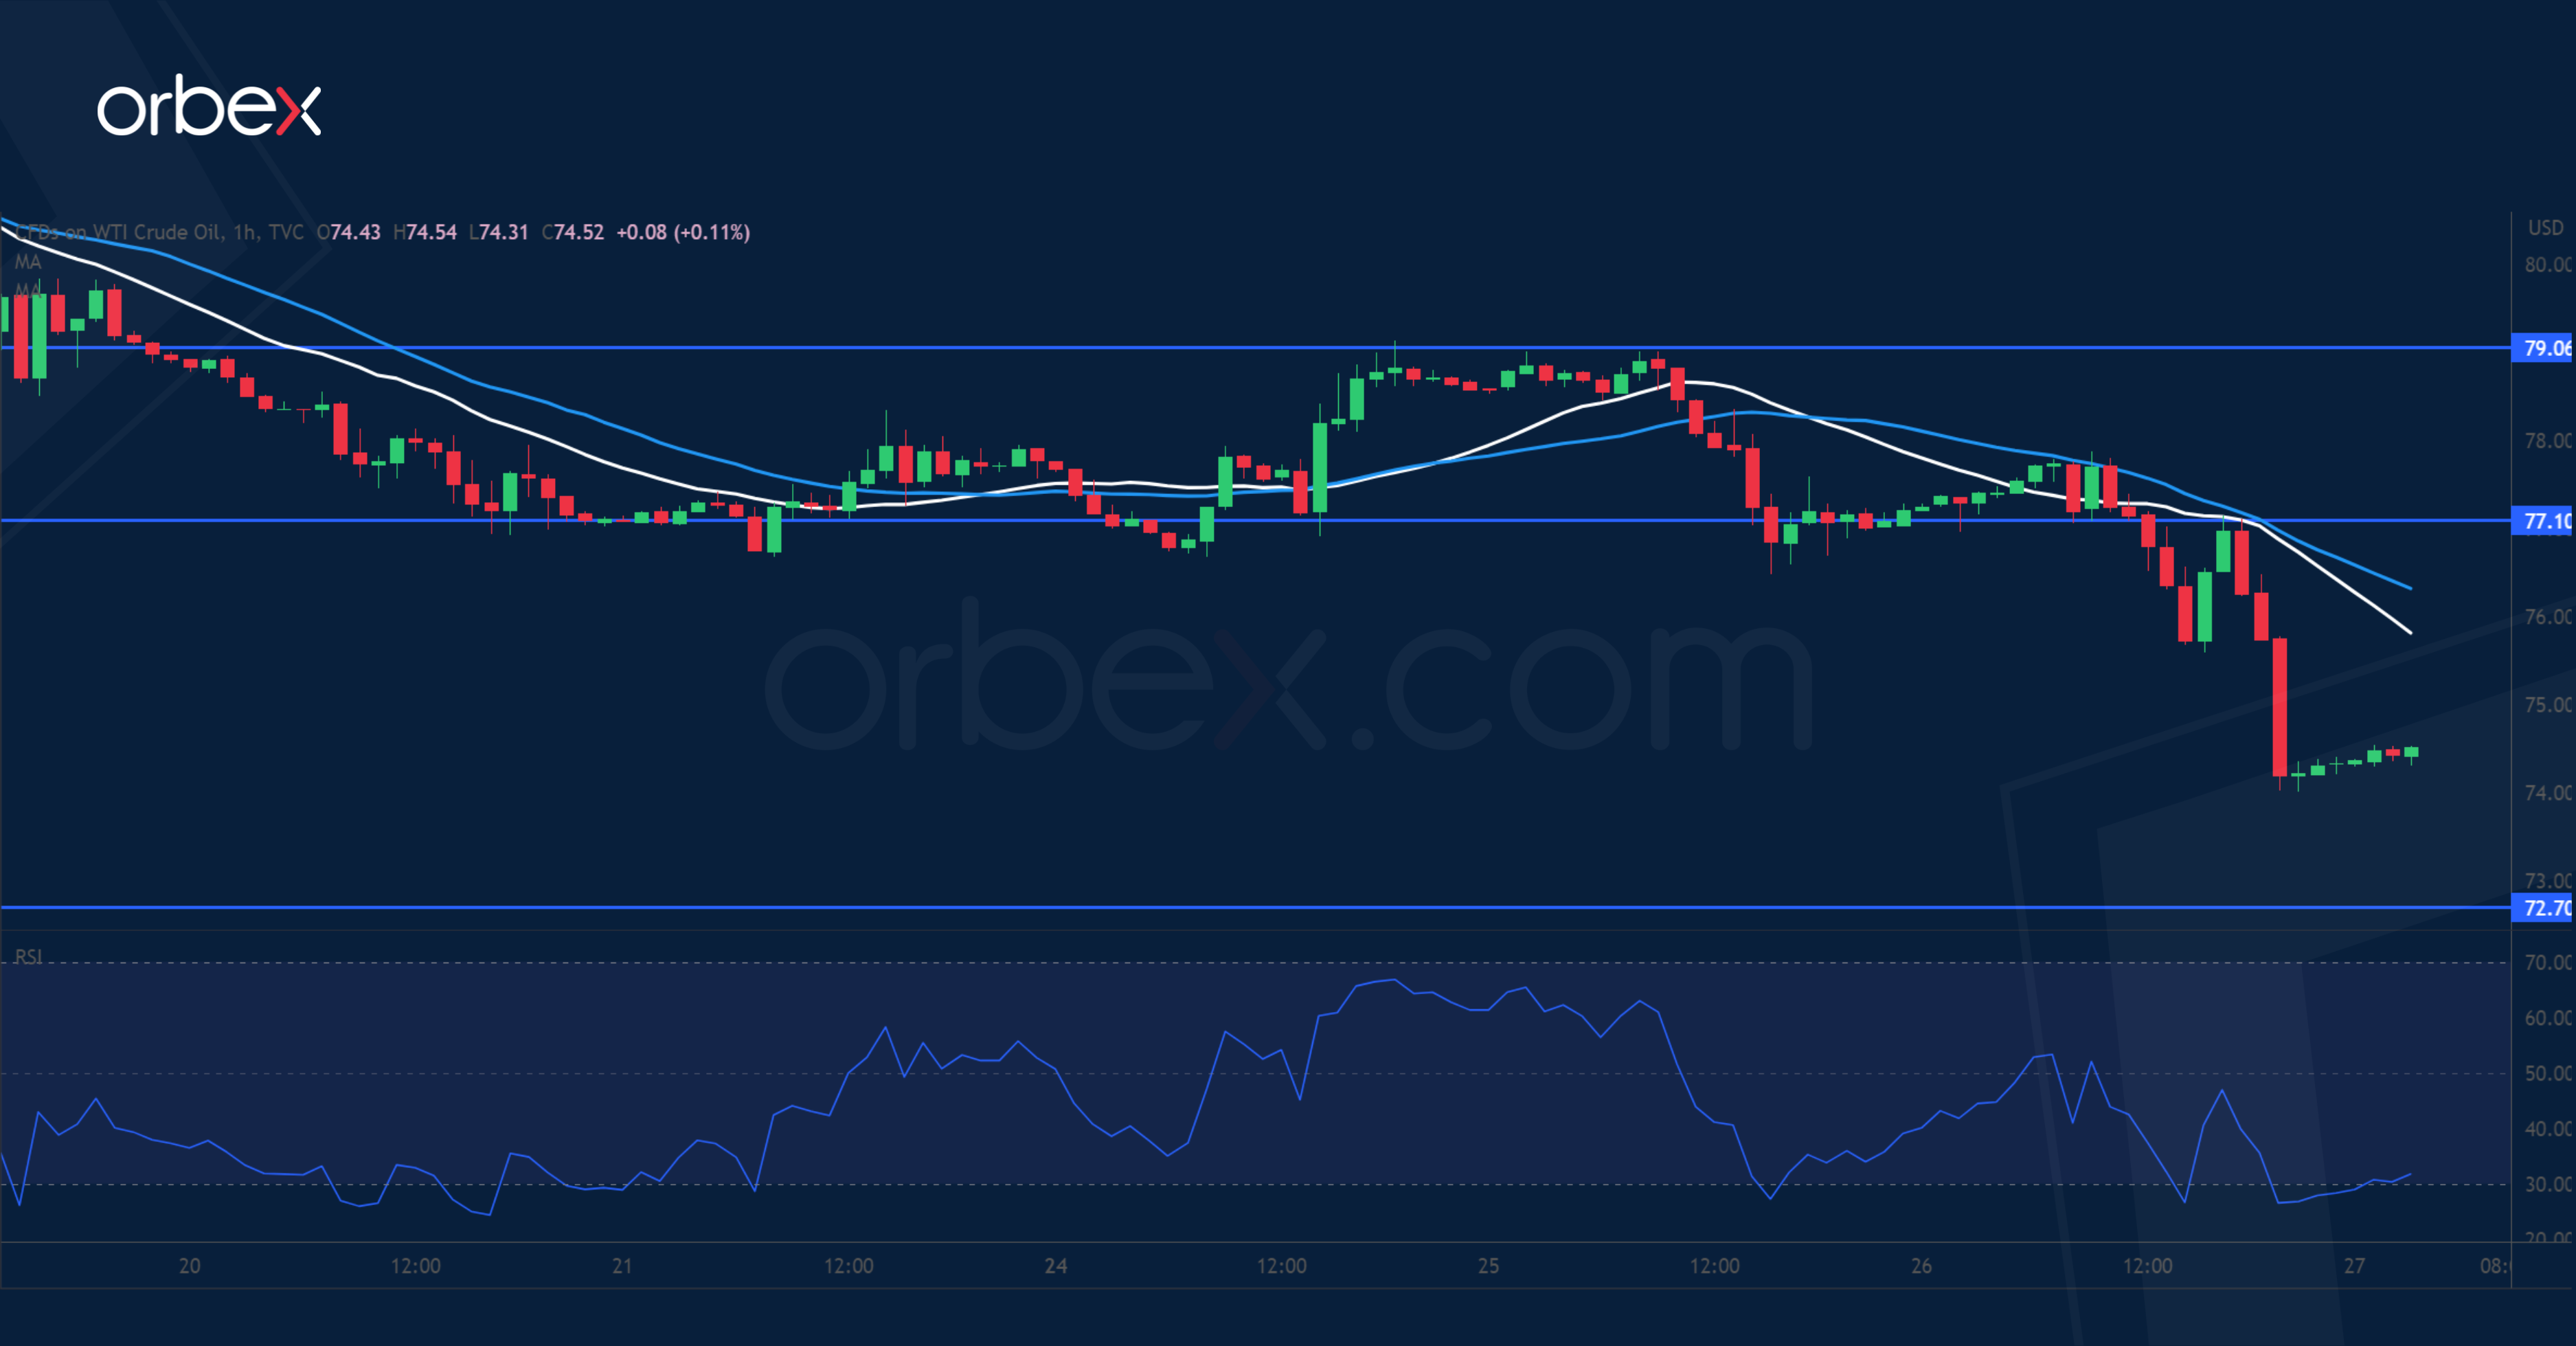
WTI crude dived as recessionary worries outweigh supply constraints. From the daily chart’s perspective, the current correction has more than filled the gap from early April and is yet to stabilise with a decisive break below 75.00 near the start of the April surge indicating lingering weakness. 72.70 is the next support as the RSI goes oversold once again. The bulls must clear 77.10 and the top of the brief rally at 79.00 before a sustained recovery could materialise, or the commodity could be vulnerable to a new round of sell-off.

